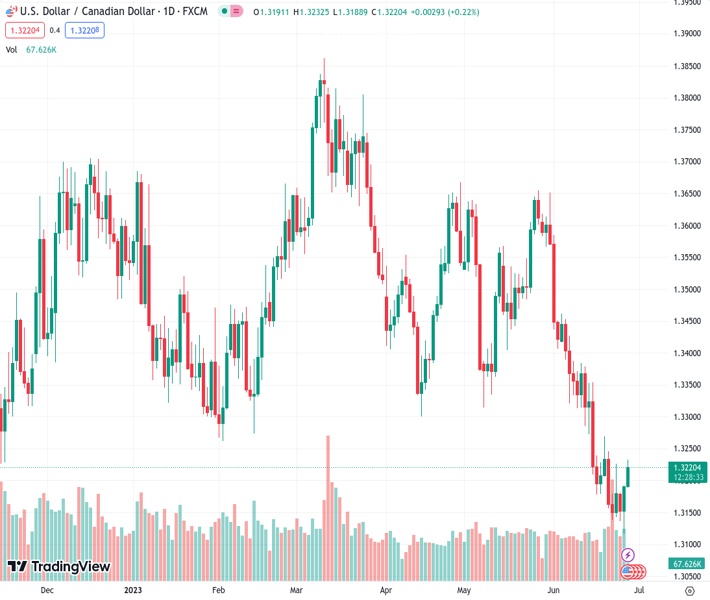
The US dollar to Canadian dollar exchange rate has reached a new weekly high at 1.3230, as it is predicted that the Bank of Canada may not increase interest rates in the near future.
…
This is a premium post.
[s2If !current_user_can(access_s2member_level4)]Please register for FREE REGISTER to read full post below containing analysis. In case of any error or you think you are not able to read the full post below, please email us at support#nehcap.com [lwa][/s2If] [s2If current_user_can(access_s2member_level1)]
- USD/CAD has refreshed its weekly high at 1.3230 as BoC might skip the interest rate hike ahead.
The pair currently trades last at 1.32187.
The previous day high was 1.3192 while the previous day low was 1.3117. The daily 38.2% Fib levels comes at 1.3163, expected to provide support. Similarly, the daily 61.8% fib level is at 1.3146, expected to provide support.
The USD/CAD pair has displayed a marginal correction after printing a fresh weekly high at 1.3230 in the European session. The Loonie asset faced heavy selling pressure after Canada’s Consumer Price Index (CPI) for May softened as expected by the market participants.
Monthly headline CPI has registered a pace of 0.4% while the street was estimating a pace of 0.5%. Last month, headline CPI showed a velocity of 0.7%. Annualized headline inflation has decelerated to 3.4% as expected by the market participants. The Bank of Canada (BoC) has got a reason to skip policy-tightening again as May’s labor market data was also below expectations.
Meanwhile, the US Dollar Index (DXY) has sensed fragile barricades around 102.70 as the focus in on the speech to be delivered by Federal Reserve (Fed) chair Jerome Powell at 13:30 GMT.
USD/CAD has delivered a breakout of the Bearish Wedge chart pattern on a two-hour scale, which indicates a bullish reversal. Potential resistance is plotted from June 07 low at 1.3321. The Loonie asset has comfortably shifted above the 50-period Exponential Moving Average (EMA) at 1.381, which conveys that the short-term trend has turned positive.
A range shift move into the 60.00-80.00 territory from the 40.00-60.00 area has activated the bullish momentum.
Going forward, a decisive move above June 07 low at 1.3321 would drive the asset to June 12 high at 1.3384 and June 06 high at 1.3452.
On the flip side, a downside move below June 16 low at 1.3177 could expose the asset to June 22 low at 1.3139 followed by the round-level support at 1.3100.
Technical Levels: Supports and Resistances
USDCAD currently trading at 1.3219 at the time of writing. Pair opened at 1.3192 and is trading with a change of 0.2 % .
| Overview | Overview.1 | |
|---|---|---|
| 0 | Today last price | 1.3219 |
| 1 | Today Daily Change | 0.0027 |
| 2 | Today Daily Change % | 0.2000 |
| 3 | Today daily open | 1.3192 |
The pair remains strongly bearish on the daily time frame. It trades below the 20 SMA @ 1.3304, 50 SMA 1.3437, 100 SMA @ 1.35 and 200 SMA @ 1.3518.
| Trends | Trends.1 | |
|---|---|---|
| 0 | Daily SMA20 | 1.3304 |
| 1 | Daily SMA50 | 1.3437 |
| 2 | Daily SMA100 | 1.3500 |
| 3 | Daily SMA200 | 1.3518 |
The previous day high was 1.3192 while the previous day low was 1.3117. The daily 38.2% Fib levels comes at 1.3163, expected to provide support. Similarly, the daily 61.8% fib level is at 1.3146, expected to provide support.
Note the levels of interest below:
- Pivot support is noted at 1.3142, 1.3091, 1.3066
- Pivot resistance is noted at 1.3217, 1.3243, 1.3293
| Levels | Levels.1 |
|---|---|
| Previous Daily High | 1.3192 |
| Previous Daily Low | 1.3117 |
| Previous Weekly High | 1.3270 |
| Previous Weekly Low | 1.3139 |
| Previous Monthly High | 1.3655 |
| Previous Monthly Low | 1.3315 |
| Daily Fibonacci 38.2% | 1.3163 |
| Daily Fibonacci 61.8% | 1.3146 |
| Daily Pivot Point S1 | 1.3142 |
| Daily Pivot Point S2 | 1.3091 |
| Daily Pivot Point S3 | 1.3066 |
| Daily Pivot Point R1 | 1.3217 |
| Daily Pivot Point R2 | 1.3243 |
| Daily Pivot Point R3 | 1.3293 |
[/s2If]
Nehcap Expert Advisor
The NEHCAP MT4 EA is high quality professional trading system geared to generate returns without using GRID or martingales. Each trade has strict risk per trade parameter. The pairs under management include EURUSD, GBPUSD, AUDCAD, AUDNZD,GBPAUD, EURAUD, EURCAD, CHFJPY and many more.
The system is trading live: LIVE ACCOUNT TRACKING
You can run it free. Apply for a free trial and track our account. Buy the system or use profit share mechanism to generate returns on your MT4.
Join Our Telegram Group
")


