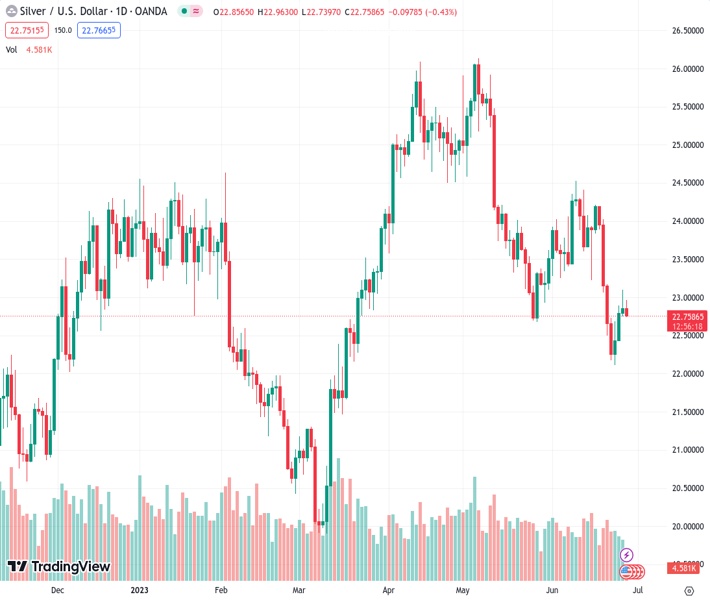
Silver encounters resistance around the $23.00 level, but it fails to maintain upward momentum.
…
This is a premium post.
[s2If !current_user_can(access_s2member_level4)]Please register for FREE REGISTER to read full post below containing analysis. In case of any error or you think you are not able to read the full post below, please email us at support#nehcap.com [lwa][/s2If] [s2If current_user_can(access_s2member_level1)]
- Silver meets with some supply in the vicinity of the $23.00 mark, albeit lacks follow-through.
The pair currently trades last at 22.741.
The previous day high was 23.1 while the previous day low was 22.75. The daily 38.2% Fib levels comes at 22.97, expected to provide resistance. Similarly, the daily 61.8% fib level is at 22.88, expected to provide resistance.
Silver attracts some sellers following an intraday uptick to the $22.95 area on Wednesday and trades with a mild negative bias heading into the European session. The white metal is currently placed around the $22.80-$22.75 region, down less than 0.20% for the day, and remains well within the previous day’s broader trading range.
From a technical perspective, the overnight failure near the 38.2% Fibonacci retracement level of the downfall witnessed over the past week or so and the subsequent downtick warrant some caution for bullish traders. Moreover, oscillators on the daily chart are holding in the bearish territory and have started gaining negative traction on the 1-hour chart. This, in turn, suggests that the recent bounce from the vicinity of the $22.00 mark, or a multi-month low touched last Friday, has run out of steam.
That said, it will still be prudent to wait for some follow-through selling below the $22.65-$22.55 confluence before positioning for any meaningful downside. The said area comprises the 100-hour Simple Moving Average (SMA) and the 23.6% Fibo., below which the XAG/USD might aim back to challenge the $22.00 mark. Some follow-through selling could accelerate the fall further towards the $21.70-$21.65 zone en route to the next relevant support near the $21.25 region and the $21.00 mark.
On the flip side, the $23.00 mark (38.2% Fibo. level) might continue to act as an immediate hurdle and is closely followed by the $23.15 confluence, comprising the 50% Fibo. level and the 200-hour SMA. This is followed by 61.8% Fibo. level, around the $23.40 area. A sustained strength beyond will confirm that the XAG/USD has formed a near-term bottom just ahead of the $22.00 mark and pave the way for some meaningful appreciating move in the near term.
Technical Levels: Supports and Resistances
XAGUSD currently trading at 22.81 at the time of writing. Pair opened at 22.86 and is trading with a change of -0.22 % .
| Overview | Overview.1 | |
|---|---|---|
| 0 | Today last price | 22.81 |
| 1 | Today Daily Change | -0.05 |
| 2 | Today Daily Change % | -0.22 |
| 3 | Today daily open | 22.86 |
The pair is trading below its 20 Daily moving average @ 23.5, below its 50 Daily moving average @ 24.1 , below its 100 Daily moving average @ 23.33 and above its 200 Daily moving average @ 22.52
| Trends | Trends.1 | |
|---|---|---|
| 0 | Daily SMA20 | 23.50 |
| 1 | Daily SMA50 | 24.10 |
| 2 | Daily SMA100 | 23.33 |
| 3 | Daily SMA200 | 22.52 |
The previous day high was 23.1 while the previous day low was 22.75. The daily 38.2% Fib levels comes at 22.97, expected to provide resistance. Similarly, the daily 61.8% fib level is at 22.88, expected to provide resistance.
Note the levels of interest below:
- Pivot support is noted at 22.71, 22.56, 22.36
- Pivot resistance is noted at 23.05, 23.25, 23.4
| Levels | Levels.1 |
|---|---|
| Previous Daily High | 23.10 |
| Previous Daily Low | 22.75 |
| Previous Weekly High | 24.20 |
| Previous Weekly Low | 22.11 |
| Previous Monthly High | 26.14 |
| Previous Monthly Low | 22.68 |
| Daily Fibonacci 38.2% | 22.97 |
| Daily Fibonacci 61.8% | 22.88 |
| Daily Pivot Point S1 | 22.71 |
| Daily Pivot Point S2 | 22.56 |
| Daily Pivot Point S3 | 22.36 |
| Daily Pivot Point R1 | 23.05 |
| Daily Pivot Point R2 | 23.25 |
| Daily Pivot Point R3 | 23.40 |
[/s2If]
Nehcap Expert Advisor
The NEHCAP MT4 EA is high quality professional trading system geared to generate returns without using GRID or martingales. Each trade has strict risk per trade parameter. The pairs under management include EURUSD, GBPUSD, AUDCAD, AUDNZD,GBPAUD, EURAUD, EURCAD, CHFJPY and many more.
The system is trading live: LIVE ACCOUNT TRACKING
You can run it free. Apply for a free trial and track our account. Buy the system or use profit share mechanism to generate returns on your MT4.
Join Our Telegram Group
")


