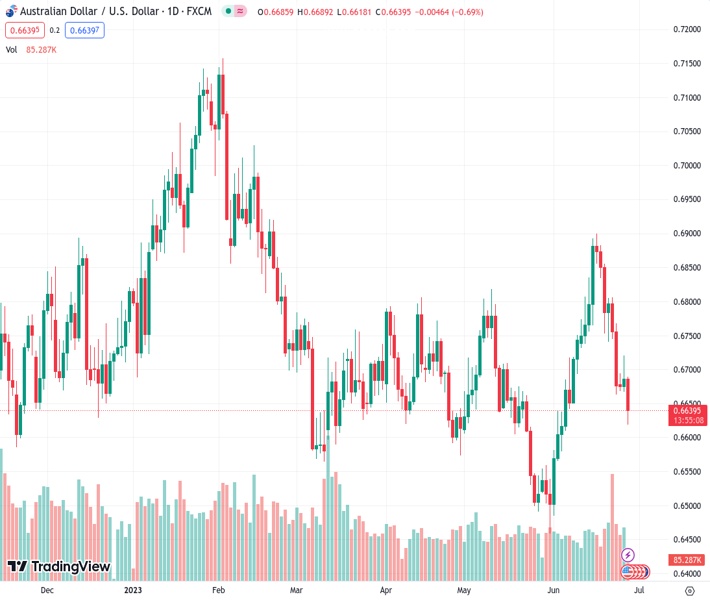
The AUDUSD currency pair, trading at a level of 0.66393, is moving back towards a three-week low that was reached following the release of Australian inflation data. This decline comes amidst uncertain and volatile market conditions.
…
This is a premium post.
[s2If !current_user_can(access_s2member_level4)]Please register for FREE REGISTER to read full post below containing analysis. In case of any error or you think you are not able to read the full post below, please email us at support#nehcap.com [lwa][/s2If] [s2If current_user_can(access_s2member_level1)]
- AUD/USD retreats towards three-week low marked after Aussie inflation release amid dicey markets.
The pair currently trades last at 0.66393.
The previous day high was 0.6721 while the previous day low was 0.667. The daily 38.2% Fib levels comes at 0.6701, expected to provide resistance. Similarly, the daily 61.8% fib level is at 0.669, expected to provide resistance.
AUD/USD drops back towards the three-week low marked after Australian inflation data as market sentiment remains dicey ahead of the key central bankers’ speeches at the European Central Bank (ECB) Forum in Sintra. That said, the Aussie pair nosedived 50-pips to 0.6618 after Australia’s Monthly Consumer Price Index (CPI) lured bears, down 0.75% on a day to around 0.6635 amid early Wednesday in Europe.
Australia’s Monthly Consumer Price Index (CPI) for May drops to 5.6% YoY versus 6.1% expected and 6.8% prior. The same amplifies concerns about the Reserve Bank of Australia’s (RBA) pause in the rate hikes after two consecutive hawkish surprises, which in turn drowns the Australian Dollar (AUD).
It should be noted that the improvement in China Industrial Profits for May, -12.6% YoY versus -18.2% prior, appeared to have put a floor under the AUD/USD price after the Aussie inflation data.
Elsewhere, the fresh fears surrounding the US-China tension, due to the Wall Street Journal (WSJ) news suggesting more AI curbs for companies from Beijing, join the upbeat US data to weigh on the AUD/USD price.
It should be noted that contrary to the recently downbeat RBA concerns, due to the Aussie inflation, the markets place heavy bets on the Fed’s 0.25% rate hike as the latest round of the US statistics have been upbeat, which in turn keeps the Aussie pair sellers hopeful of witnessing further downside.
However, Fed Chairman Jerome Powell needs to strongly confirm the July rate hike, as well as tease a few more in 2023 and rule out the rate cuts, to defend the AUD/USD bears. Otherwise, hopes of gradual economic recovery in the US and China may underpin the consolidation of the latest losses.
With a clear U-turn from the 200-DMA, around 0.6695 by the press time, the AUD/USD pair becomes vulnerable to decline towards an ascending support line from early March, close to 0.6585 at the latest.
Technical Levels: Supports and Resistances
AUDUSD currently trading at 0.6635 at the time of writing. Pair opened at 0.6686 and is trading with a change of -0.76% % .
| Overview | Overview.1 | |
|---|---|---|
| 0 | Today last price | 0.6635 |
| 1 | Today Daily Change | -0.0051 |
| 2 | Today Daily Change % | -0.76% |
| 3 | Today daily open | 0.6686 |
The pair remains strongly bearish on the daily time frame. It trades below the 20 SMA @ 0.6719, 50 SMA 0.6679, 100 SMA @ 0.6709 and 200 SMA @ 0.6692.
| Trends | Trends.1 | |
|---|---|---|
| 0 | Daily SMA20 | 0.6719 |
| 1 | Daily SMA50 | 0.6679 |
| 2 | Daily SMA100 | 0.6709 |
| 3 | Daily SMA200 | 0.6692 |
The previous day high was 0.6721 while the previous day low was 0.667. The daily 38.2% Fib levels comes at 0.6701, expected to provide resistance. Similarly, the daily 61.8% fib level is at 0.669, expected to provide resistance.
Note the levels of interest below:
- Pivot support is noted at 0.6664, 0.6642, 0.6613
- Pivot resistance is noted at 0.6715, 0.6743, 0.6766
| Levels | Levels.1 |
|---|---|
| Previous Daily High | 0.6721 |
| Previous Daily Low | 0.6670 |
| Previous Weekly High | 0.6886 |
| Previous Weekly Low | 0.6663 |
| Previous Monthly High | 0.6818 |
| Previous Monthly Low | 0.6458 |
| Daily Fibonacci 38.2% | 0.6701 |
| Daily Fibonacci 61.8% | 0.6690 |
| Daily Pivot Point S1 | 0.6664 |
| Daily Pivot Point S2 | 0.6642 |
| Daily Pivot Point S3 | 0.6613 |
| Daily Pivot Point R1 | 0.6715 |
| Daily Pivot Point R2 | 0.6743 |
| Daily Pivot Point R3 | 0.6766 |
[/s2If]
Nehcap Expert Advisor
The NEHCAP MT4 EA is high quality professional trading system geared to generate returns without using GRID or martingales. Each trade has strict risk per trade parameter. The pairs under management include EURUSD, GBPUSD, AUDCAD, AUDNZD,GBPAUD, EURAUD, EURCAD, CHFJPY and many more.
The system is trading live: LIVE ACCOUNT TRACKING
You can run it free. Apply for a free trial and track our account. Buy the system or use profit share mechanism to generate returns on your MT4.
Join Our Telegram Group
")


