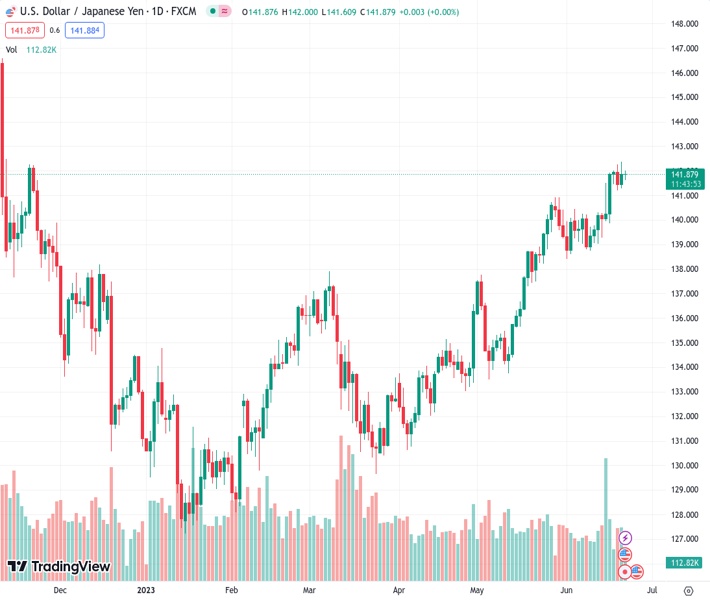
On Thursday, for the second consecutive day, there is a surge in buying near the 100-hour SMA for #USDJPY @ 141.870.
…
This is a premium post.
[s2If !current_user_can(access_s2member_level4)]Please register for FREE REGISTER to read full post below containing analysis. In case of any error or you think you are not able to read the full post below, please email us at support#nehcap.com [lwa][/s2If] [s2If current_user_can(access_s2member_level1)]
- USD/JPY attracts some buying near the 100-hour SMA for the second straight day on Thursday.
The pair currently trades last at 141.870.
The previous day high was 142.37 while the previous day low was 141.28. The daily 38.2% Fib levels comes at 141.95, expected to provide resistance. Similarly, the daily 61.8% fib level is at 141.7, expected to provide support.
The USD/JPY pair finds support near the 100-hour Simple Moving Average (SMA) for the second straight day on Thursday and climbs back to the 142.00 neighbourhood during the early European session. Spot prices, however, remain below the YTD peak touched on Wednesday and well within a familiar trading range held since the beginning of the current week.
Against the backdrop of the recent appreciating move witnessed over the past two weeks or so, the rang-bound price action might still be categorized as a bullish consolidation phase. Furthermore, last week’s sustained breakout through a horizontal resistance near the 141.00 mark supports prospects for additional gains. That said, the Relative Strength Index (RSI) on the daily chart is hovering just below the overbought territory and holding back traders from placing fresh bullish bets around the USD/JPY pair.
Nevertheless, spot prices remain on track to build on over a one-month-old uptrend and climb further beyond the 142.35 area, or the highest level since November 2022 touched on Wednesday, towards reclaiming the 143.00 round figure. The upward trajectory could get extended further towards the next relevant hurdle near the 143.75 region en route to the 144.00 mark. The USD/JPY pair might eventually climb to the 144.30-144.35 intermediate hurdle, above which bulls might aim to reclaim the 145.00 psychological mark.
On the flip side, the 100-hour SMA, currently around the 141.670-141.65 area, now seems to protect the immediate downside ahead of the 141.30-141.20 area, or the weekly low. A convincing break below the latter might prompt some technical selling and drag the USD/JPY pair below the 141.00 mark, towards the 140.60-140.55 horizontal support. Any subsequent decline might attract fresh buyers near the 140.25 zone and remain limited near the 140.00 psychological mark. The latter should act as a strong base for spot prices, which if broken might shift the bias in favour of bearish traders.
Technical Levels: Supports and Resistances
USDJPY currently trading at 141.98 at the time of writing. Pair opened at 141.88 and is trading with a change of 0.07 % .
| Overview | Overview.1 | |
|---|---|---|
| 0 | Today last price | 141.98 |
| 1 | Today Daily Change | 0.10 |
| 2 | Today Daily Change % | 0.07 |
| 3 | Today daily open | 141.88 |
The pair remains strongly bullish on the daily timeframe. It trades above its 20 SMA @ 140.21, 50 SMA 137.4, 100 SMA @ 135.37 and 200 SMA @ 137.21.
| Trends | Trends.1 | |
|---|---|---|
| 0 | Daily SMA20 | 140.21 |
| 1 | Daily SMA50 | 137.40 |
| 2 | Daily SMA100 | 135.37 |
| 3 | Daily SMA200 | 137.21 |
The previous day high was 142.37 while the previous day low was 141.28. The daily 38.2% Fib levels comes at 141.95, expected to provide resistance. Similarly, the daily 61.8% fib level is at 141.7, expected to provide support.
Note the levels of interest below:
- Pivot support is noted at 141.32, 140.76, 140.24
- Pivot resistance is noted at 142.41, 142.93, 143.49
| Levels | Levels.1 |
|---|---|
| Previous Daily High | 142.37 |
| Previous Daily Low | 141.28 |
| Previous Weekly High | 141.92 |
| Previous Weekly Low | 139.01 |
| Previous Monthly High | 140.93 |
| Previous Monthly Low | 133.50 |
| Daily Fibonacci 38.2% | 141.95 |
| Daily Fibonacci 61.8% | 141.70 |
| Daily Pivot Point S1 | 141.32 |
| Daily Pivot Point S2 | 140.76 |
| Daily Pivot Point S3 | 140.24 |
| Daily Pivot Point R1 | 142.41 |
| Daily Pivot Point R2 | 142.93 |
| Daily Pivot Point R3 | 143.49 |
[/s2If]
Nehcap Expert Advisor
The NEHCAP MT4 EA is high quality professional trading system geared to generate returns without using GRID or martingales. Each trade has strict risk per trade parameter. The pairs under management include EURUSD, GBPUSD, AUDCAD, AUDNZD,GBPAUD, EURAUD, EURCAD, CHFJPY and many more.
The system is trading live: LIVE ACCOUNT TRACKING
You can run it free. Apply for a free trial and track our account. Buy the system or use profit share mechanism to generate returns on your MT4.
Join Our Telegram Group
")


