Silver has been consistently low for the fourth day in a row and is currently hovering close to its lowest point in three months, showing no signs of improvement. #XAGUSD @ 22.556
…
This is a premium post.
[s2If !current_user_can(access_s2member_level4)]Please register for FREE REGISTER to read full post below containing analysis. In case of any error or you think you are not able to read the full post below, please email us at support#nehcap.com [lwa][/s2If] [s2If current_user_can(access_s2member_level1)]
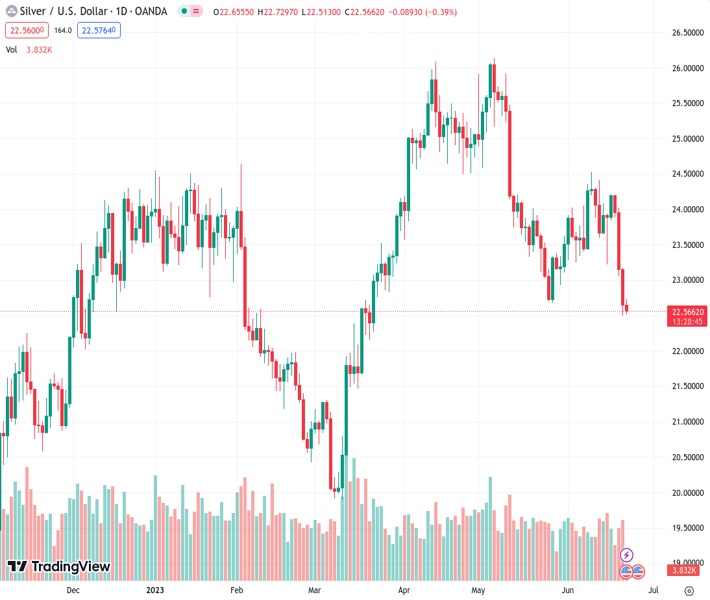
- Silver remains depressed for the fourth straight day and languishes near a three-month low.
The pair currently trades last at 22.556.
The previous day high was 23.18 while the previous day low was 22.5. The daily 38.2% Fib levels comes at 22.76, expected to provide resistance. Similarly, the daily 61.8% fib level is at 22.92, expected to provide resistance.
Silver enters a bearish consolidation phase on Thursday and oscillates in a narrow trading band around the $22.50-$22.60 area or a three-month low touched the previous day. The white metal, however, manages to hold its neck just above the very important 200-day Simple Moving Average (SMA) support, which should act as a key pivotal point for short-term traders.
Against the backdrop of the recent failure near the 50-day SMA, bearish oscillators on the daily chart support prospects for an eventual breakdown through the technically significant moving average. Some follow-through selling below the $22.25 area, representing the 61.8% Fibonacci retracement level of the March-May rally, will be seen as a fresh trigger for bearish traders and pave the way for further losses.
The XAG/USD might then turn vulnerable to weaken further below the $22.00 mark and accelerate the downfall towards testing the $21.70-$21.65 support zone. The downward trajectory could get extended towards the $21.25 intermediate support en route to the $21.00 round figure and the next relevant support near the $20.50 area. Bears might eventually target the YTD low, levels just below the $20.00 psychological mark.
On the flip side, any meaningful recovery attempt might now confront stiff resistance near the $23.00 mark, which coincides with the 50% Fibo. level. That said, a sustained strength beyond could trigger a short-covering rally and lift the XAG/USD to the $23.30-$23.35 intermediate hurdle en route to 38.2% Fibo. level, around the $23.70-$23.75 zone. The latter should act as a key barrier and cap any further gains.
Technical Levels: Supports and Resistances
XAGUSD currently trading at 22.54 at the time of writing. Pair opened at 22.66 and is trading with a change of -0.53 % .
| Overview | Overview.1 | |
|---|---|---|
| 0 | Today last price | 22.54 |
| 1 | Today Daily Change | -0.12 |
| 2 | Today Daily Change % | -0.53 |
| 3 | Today daily open | 22.66 |
The pair is trading below its 20 Daily moving average @ 23.61, below its 50 Daily moving average @ 24.32 , below its 100 Daily moving average @ 23.35 and above its 200 Daily moving average @ 22.46
| Trends | Trends.1 | |
|---|---|---|
| 0 | Daily SMA20 | 23.61 |
| 1 | Daily SMA50 | 24.32 |
| 2 | Daily SMA100 | 23.35 |
| 3 | Daily SMA200 | 22.46 |
The previous day high was 23.18 while the previous day low was 22.5. The daily 38.2% Fib levels comes at 22.76, expected to provide resistance. Similarly, the daily 61.8% fib level is at 22.92, expected to provide resistance.
Note the levels of interest below:
- Pivot support is noted at 22.38, 22.1, 21.7
- Pivot resistance is noted at 23.06, 23.46, 23.75
| Levels | Levels.1 |
|---|---|
| Previous Daily High | 23.18 |
| Previous Daily Low | 22.50 |
| Previous Weekly High | 24.40 |
| Previous Weekly Low | 23.22 |
| Previous Monthly High | 26.14 |
| Previous Monthly Low | 22.68 |
| Daily Fibonacci 38.2% | 22.76 |
| Daily Fibonacci 61.8% | 22.92 |
| Daily Pivot Point S1 | 22.38 |
| Daily Pivot Point S2 | 22.10 |
| Daily Pivot Point S3 | 21.70 |
| Daily Pivot Point R1 | 23.06 |
| Daily Pivot Point R2 | 23.46 |
| Daily Pivot Point R3 | 23.75 |
[/s2If]
Nehcap Expert Advisor
The NEHCAP MT4 EA is high quality professional trading system geared to generate returns without using GRID or martingales. Each trade has strict risk per trade parameter. The pairs under management include EURUSD, GBPUSD, AUDCAD, AUDNZD,GBPAUD, EURAUD, EURCAD, CHFJPY and many more.
The system is trading live: LIVE ACCOUNT TRACKING
You can run it free. Apply for a free trial and track our account. Buy the system or use profit share mechanism to generate returns on your MT4.
Join Our Telegram Group
")


