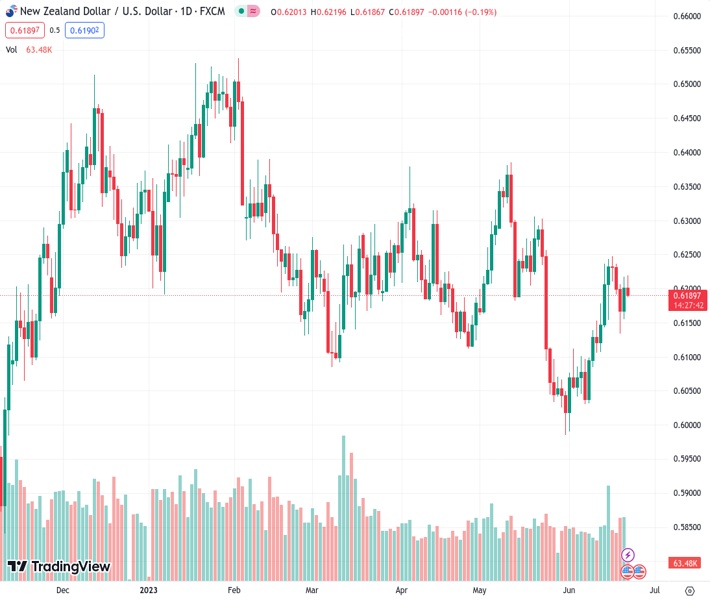
The NZD/USD currency pair is currently trading at 0.61882, and is consolidating after recovering from the previous day’s losses. This consolidation pattern is forming inside a symmetrical triangle that is one-month-old. According to @nehcap, the expectation is that there will be an upward movement in the currency pair.
…
This is a premium post.
[s2If !current_user_can(access_s2member_level4)]Please register for FREE REGISTER to read full post below containing analysis. In case of any error or you think you are not able to read the full post below, please email us at support#nehcap.com [lwa][/s2If] [s2If current_user_can(access_s2member_level1)]
- NZD/USD consolidates the previous day’s recovery inside one-month-old symmetrical triangle.
The pair currently trades last at 0.61882.
The previous day high was 0.6219 while the previous day low was 0.6156. The daily 38.2% Fib levels comes at 0.6195, expected to provide resistance. Similarly, the daily 61.8% fib level is at 0.618, expected to provide support.
NZD/USD clings to mild losses around 0.6190 as it reverses the previous day’s rebound heading into Thursday’s European session. In doing so, the Kiwi pair retreats within a one-month-old symmetrical triangle, funning down towards the breakout points of late.
That said, the early Thursday’s Gravestone Doji candlestick on the four-hour chart joins the downbeat sentiment to exert downside pressure on the NZD/USD price.
Suggesting another attempt to break the 100-bar Exponential Moving Average (EMA) surrounding 0.6155.
Following that, the stated triangle’s bottom line of near 0.6150 and a one-month-long horizontal support zone surrounding 0.6100 will lure the NZD/USD bears.
Meanwhile, the 61.8% Fibonacci retracement of its May 11-31 downside, near 0.6230, guards the immediate upside of the NZD/USD pair, a break of which will highlight the aforementioned triangle’s top line, close to 0.6240 at the latest.
In a case where the Kiwi pair manages to remain firmer past 0.6240, the late May swing high of around 0.6310 can act as an extra filter towards the north before giving control to the bulls.
To sum up, NZD/USD pair is suggesting an intraday fall but the overall bullish bias remains intact.
Trend: Upside expected
Technical Levels: Supports and Resistances
NZDUSD currently trading at 0.6189 at the time of writing. Pair opened at 0.6202 and is trading with a change of -0.21% % .
| Overview | Overview.1 | |
|---|---|---|
| 0 | Today last price | 0.6189 |
| 1 | Today Daily Change | -0.0013 |
| 2 | Today Daily Change % | -0.21% |
| 3 | Today daily open | 0.6202 |
The pair is trading above its 20 Daily moving average @ 0.6114, above its 50 Daily moving average @ 0.6177 , below its 100 Daily moving average @ 0.621 and above its 200 Daily moving average @ 0.6154
| Trends | Trends.1 | |
|---|---|---|
| 0 | Daily SMA20 | 0.6114 |
| 1 | Daily SMA50 | 0.6177 |
| 2 | Daily SMA100 | 0.6210 |
| 3 | Daily SMA200 | 0.6154 |
The previous day high was 0.6219 while the previous day low was 0.6156. The daily 38.2% Fib levels comes at 0.6195, expected to provide resistance. Similarly, the daily 61.8% fib level is at 0.618, expected to provide support.
Note the levels of interest below:
- Pivot support is noted at 0.6166, 0.6129, 0.6103
- Pivot resistance is noted at 0.6229, 0.6255, 0.6292
| Levels | Levels.1 |
|---|---|
| Previous Daily High | 0.6219 |
| Previous Daily Low | 0.6156 |
| Previous Weekly High | 0.6250 |
| Previous Weekly Low | 0.6076 |
| Previous Monthly High | 0.6385 |
| Previous Monthly Low | 0.5985 |
| Daily Fibonacci 38.2% | 0.6195 |
| Daily Fibonacci 61.8% | 0.6180 |
| Daily Pivot Point S1 | 0.6166 |
| Daily Pivot Point S2 | 0.6129 |
| Daily Pivot Point S3 | 0.6103 |
| Daily Pivot Point R1 | 0.6229 |
| Daily Pivot Point R2 | 0.6255 |
| Daily Pivot Point R3 | 0.6292 |
[/s2If]
Nehcap Expert Advisor
The NEHCAP MT4 EA is high quality professional trading system geared to generate returns without using GRID or martingales. Each trade has strict risk per trade parameter. The pairs under management include EURUSD, GBPUSD, AUDCAD, AUDNZD,GBPAUD, EURAUD, EURCAD, CHFJPY and many more.
The system is trading live: LIVE ACCOUNT TRACKING
You can run it free. Apply for a free trial and track our account. Buy the system or use profit share mechanism to generate returns on your MT4.
Join Our Telegram Group
")


