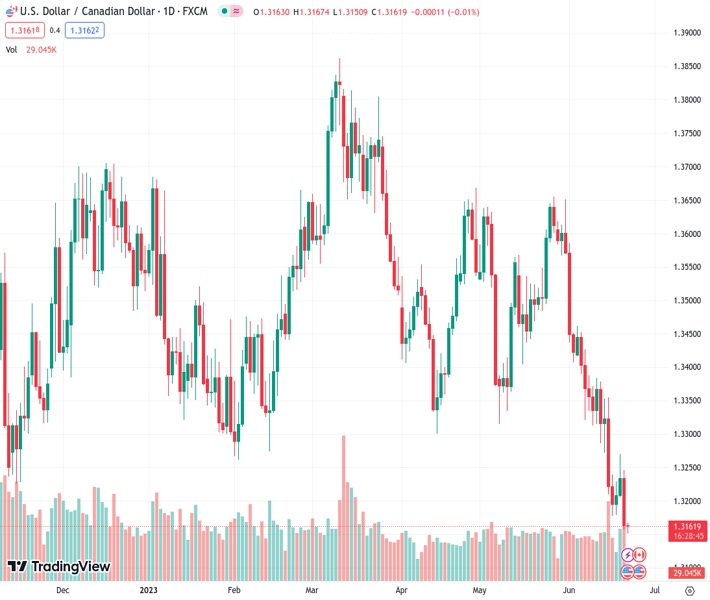
During Thursday’s Asian session, the USDCAD has fallen to its lowest point since September 2022, marked at a value of 1.31617.
…
This is a premium post.
[s2If !current_user_can(access_s2member_level4)]Please register for FREE REGISTER to read full post below containing analysis. In case of any error or you think you are not able to read the full post below, please email us at support#nehcap.com [lwa][/s2If] [s2If current_user_can(access_s2member_level1)]
- USD/CAD drops to its lowest level since September 2022 during the Asian session on Thursday.
The pair currently trades last at 1.31617.
The previous day high was 1.3246 while the previous day low was 1.3157. The daily 38.2% Fib levels comes at 1.3191, expected to provide resistance. Similarly, the daily 61.8% fib level is at 1.3212, expected to provide resistance.
The USD/CAD pair adds to the previous day’s heavy losses and remains depressed for the second successive day on Thursday, hitting its lowest level since September 2022 around mid-1.3100s during the Asian session.
Crude Oil prices consolidate near a two-week high touched on Wednesday and continue to underpin the commodity-linked Loonie. The US Dollar (USD), on the other hand, is seen hovering around the monthly low in the wake of the overnight less hawkish remarks by Federal Reserve (Fed) Chair Jerome Powell, saying that it may make sense to raise rates at a more moderate pace. This, in turn, exerts some downward pressure on the USD/CAD pair, though a combination of factors helps limit further losses, at least for the time being.
Worries that a global economic downturn, particularly in China, act as a headwind for Crude Oil prices. Furthermore, bets for at least a 25 bps Fed rate hike in July hold back traders from placing aggressive bearish bets around the USD and lend support to the USD/CAD pair. Testifying before the House Financial Services Committee, Powell noted that the fight against inflation is still not over and despite the latest pause, officials agreed borrowing costs would likely need to move higher. This reinforced expectations for further tightening by the Fed.
Apart from this, a generally weaker tone around the equity markets could benefit the Greenback’s relative safe-haven status. Moreover, the Relative Strength Index (RSI) on the daily chart is flashing oversold conditions and supports prospects for a modest recovery for the USD/CAD pair. That said, the lack of any meaningful buying suggests that the recent bearish trend witnessed over the past month or so is still far from being over and that the path of least resistance for spot prices is to the downside. This, in turn, warrants caution for bullish traders.
Market participants now look to Powell’s second day of testimony before the Senate Banking Committee. Any signals on monetary policy will influence the USD and provide a fresh impetus to the USD/CAD pair. Traders on Thursday will further take cues from the US economic docket, featuring the release of Weekly Initial Jobless Claims and Existing Home Sales data later during the early North American session. This, along with Oil price dynamics, might further contribute to producing short-term trading opportunities around the major.
Technical Levels: Supports and Resistances
USDCAD currently trading at 1.3157 at the time of writing. Pair opened at 1.3164 and is trading with a change of -0.05 % .
| Overview | Overview.1 | |
|---|---|---|
| 0 | Today last price | 1.3157 |
| 1 | Today Daily Change | -0.0007 |
| 2 | Today Daily Change % | -0.0500 |
| 3 | Today daily open | 1.3164 |
The pair remains strongly bearish on the daily time frame. It trades below the 20 SMA @ 1.3393, 50 SMA 1.3453, 100 SMA @ 1.3508 and 200 SMA @ 1.352.
| Trends | Trends.1 | |
|---|---|---|
| 0 | Daily SMA20 | 1.3393 |
| 1 | Daily SMA50 | 1.3453 |
| 2 | Daily SMA100 | 1.3508 |
| 3 | Daily SMA200 | 1.3520 |
The previous day high was 1.3246 while the previous day low was 1.3157. The daily 38.2% Fib levels comes at 1.3191, expected to provide resistance. Similarly, the daily 61.8% fib level is at 1.3212, expected to provide resistance.
Note the levels of interest below:
- Pivot support is noted at 1.3132, 1.31, 1.3044
- Pivot resistance is noted at 1.3221, 1.3278, 1.3309
| Levels | Levels.1 |
|---|---|
| Previous Daily High | 1.3246 |
| Previous Daily Low | 1.3157 |
| Previous Weekly High | 1.3384 |
| Previous Weekly Low | 1.3178 |
| Previous Monthly High | 1.3655 |
| Previous Monthly Low | 1.3315 |
| Daily Fibonacci 38.2% | 1.3191 |
| Daily Fibonacci 61.8% | 1.3212 |
| Daily Pivot Point S1 | 1.3132 |
| Daily Pivot Point S2 | 1.3100 |
| Daily Pivot Point S3 | 1.3044 |
| Daily Pivot Point R1 | 1.3221 |
| Daily Pivot Point R2 | 1.3278 |
| Daily Pivot Point R3 | 1.3309 |
[/s2If]
Nehcap Expert Advisor
The NEHCAP MT4 EA is high quality professional trading system geared to generate returns without using GRID or martingales. Each trade has strict risk per trade parameter. The pairs under management include EURUSD, GBPUSD, AUDCAD, AUDNZD,GBPAUD, EURAUD, EURCAD, CHFJPY and many more.
The system is trading live: LIVE ACCOUNT TRACKING
You can run it free. Apply for a free trial and track our account. Buy the system or use profit share mechanism to generate returns on your MT4.
Join Our Telegram Group
")


