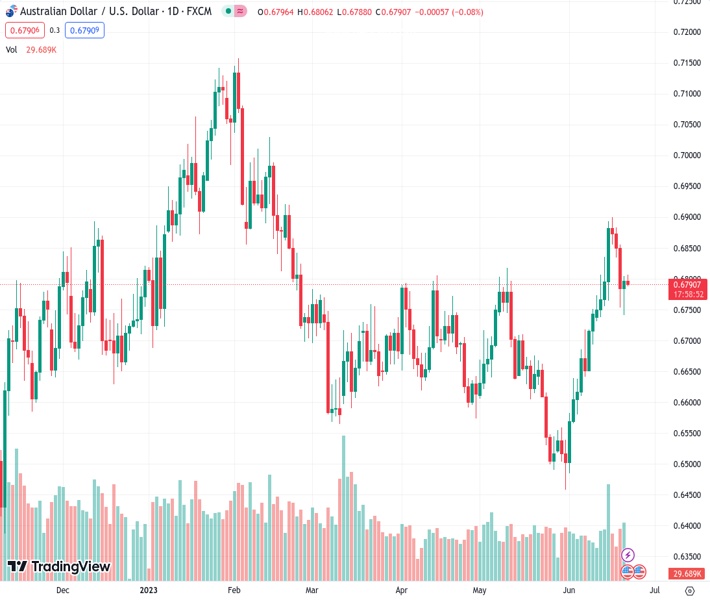
The AUDUSD currency pair, currently trading at 0.67892, is retracting from a recent rebound from its weekly low. The decline is said to have been prompted by a descending trend line originating from Friday which has been bullish for the currency. According to the viewpoint of @nehcap, the downside is likely to be minimal.
…
This is a premium post.
[s2If !current_user_can(access_s2member_level4)]Please register for FREE REGISTER to read full post below containing analysis. In case of any error or you think you are not able to read the full post below, please email us at support#nehcap.com [lwa][/s2If] [s2If current_user_can(access_s2member_level1)]
- AUD/USD fades the previous day’s rebound from weekly low as descending trend line from Friday prod bulls.
The pair currently trades last at 0.67892.
The previous day high was 0.6804 while the previous day low was 0.6741. The daily 38.2% Fib levels comes at 0.678, expected to provide support. Similarly, the daily 61.8% fib level is at 0.6765, expected to provide support.
AUD/USD fails to extend the previous day’s corrective bounce off a one-week low, as well as the 100-Exponential Moving Average (EMA), amid early Thursday in Europe. In doing so, the risk-barometer pair portrays the market’s cautious mood ahead of multiple central bank announcements while also suffering from China’s holiday.
AUD/USD pair’s latest retreat could be linked to its inability to cross the weekly resistance line, around 0.6810 by the press time.
However, the quote’s sustained trading beyond the 100-EMA and 200-EMA, as well as an impending bull cross on the MACD indicator, challenge the Aussie pair sellers.
Apart from the 100-EMA and 200-EMA, respectively near 0.6745 and 0.6700, a horizontal area comprising multiple levels marked since June 02, close to 0.6640, also appears to challenge the AUD/USD bears before giving them control.
Alternatively, a successful break of the aforementioned resistance line from Friday, close to 0.6810 at the latest, can trigger the AUD/USD pair’s run-up towards refreshing the monthly top, currently around 0.6900.
It should be noted that a one-week-long horizontal region around 0.6840 acts as an extra filter towards the north.
Trend: Limited downside expected
Technical Levels: Supports and Resistances
AUDUSD currently trading at 0.6797 at the time of writing. Pair opened at 0.6797 and is trading with a change of 0.00% % .
| Overview | Overview.1 | |
|---|---|---|
| 0 | Today last price | 0.6797 |
| 1 | Today Daily Change | 0.0000 |
| 2 | Today Daily Change % | 0.00% |
| 3 | Today daily open | 0.6797 |
The pair remains strongly bullish on the daily timeframe. It trades above its 20 SMA @ 0.6683, 50 SMA 0.6681, 100 SMA @ 0.672 and 200 SMA @ 0.6692.
| Trends | Trends.1 | |
|---|---|---|
| 0 | Daily SMA20 | 0.6683 |
| 1 | Daily SMA50 | 0.6681 |
| 2 | Daily SMA100 | 0.6720 |
| 3 | Daily SMA200 | 0.6692 |
The previous day high was 0.6804 while the previous day low was 0.6741. The daily 38.2% Fib levels comes at 0.678, expected to provide support. Similarly, the daily 61.8% fib level is at 0.6765, expected to provide support.
Note the levels of interest below:
- Pivot support is noted at 0.6757, 0.6717, 0.6693
- Pivot resistance is noted at 0.682, 0.6844, 0.6884
| Levels | Levels.1 |
|---|---|
| Previous Daily High | 0.6804 |
| Previous Daily Low | 0.6741 |
| Previous Weekly High | 0.6900 |
| Previous Weekly Low | 0.6732 |
| Previous Monthly High | 0.6818 |
| Previous Monthly Low | 0.6458 |
| Daily Fibonacci 38.2% | 0.6780 |
| Daily Fibonacci 61.8% | 0.6765 |
| Daily Pivot Point S1 | 0.6757 |
| Daily Pivot Point S2 | 0.6717 |
| Daily Pivot Point S3 | 0.6693 |
| Daily Pivot Point R1 | 0.6820 |
| Daily Pivot Point R2 | 0.6844 |
| Daily Pivot Point R3 | 0.6884 |
[/s2If]
Nehcap Expert Advisor
The NEHCAP MT4 EA is high quality professional trading system geared to generate returns without using GRID or martingales. Each trade has strict risk per trade parameter. The pairs under management include EURUSD, GBPUSD, AUDCAD, AUDNZD,GBPAUD, EURAUD, EURCAD, CHFJPY and many more.
The system is trading live: LIVE ACCOUNT TRACKING
You can run it free. Apply for a free trial and track our account. Buy the system or use profit share mechanism to generate returns on your MT4.
Join Our Telegram Group
")


