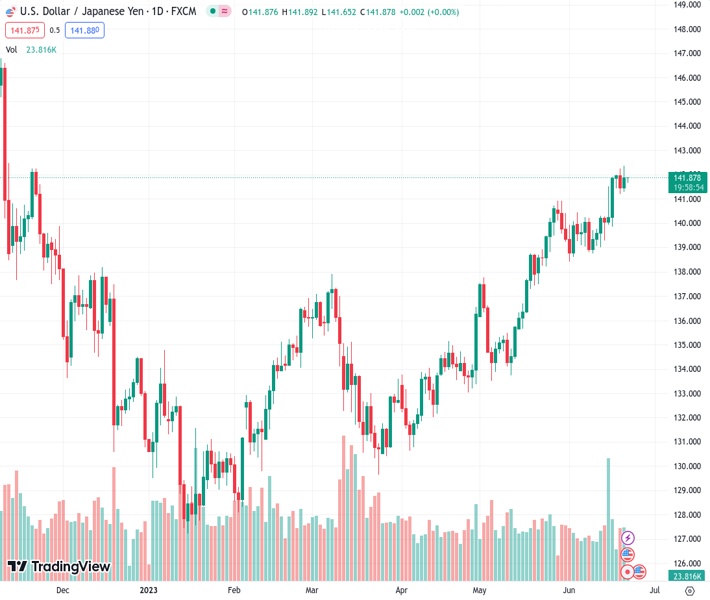
The USDJPY reached a new YTD high on Wednesday at 141.873 but has since retreated. However, there hasn’t been a significant continuation in the drop.
…
This is a premium post.
[s2If !current_user_can(access_s2member_level4)]Please register for FREE REGISTER to read full post below containing analysis. In case of any error or you think you are not able to read the full post below, please email us at support#nehcap.com [lwa][/s2If] [s2If current_user_can(access_s2member_level1)]
- USD/JPY pulls back from a fresh YTD peak touched on Wednesday, albeit lacks follow-through.
The pair currently trades last at 141.873.
The previous day high was 142.37 while the previous day low was 141.28. The daily 38.2% Fib levels comes at 141.95, expected to provide resistance. Similarly, the daily 61.8% fib level is at 141.7, expected to provide support.
The USD/JPY pair edges lower during the Asian session on Thursday and moves away from a fresh high since November 2022, around the 142.35 area touched the previous day. Spot prices, however, manage to hold above the 100-hour Simple Moving Average (SMA) and currently trade just below the 142.00 round-figure mark.
The US Dollar (USD) consolidates the overnight slide back closer to the monthly low in the wake of Federal Reserve (Fed) Chair Jerome Powell’s less hawkish remarks and turns out to be a key factor acting as a headwind for the USD/JPY pair. Testifying before the House Financial Services Committee on Wednesday, Powell noted that inflation remains very far from the Fed’s target, though it may make sense to raise rates at a more moderate pace.
Powell, however, added that the fight against inflation still has a long way to go and despite a recent pause in interest rate hikes, officials agreed borrowing costs would likely need to move higher, which helps limit the downside for the USD. Apart from this, a more dovish stance adopted by the Bank of Japan (JPY) continues to undermine the Japanese Yen (JPY) and holds back bearish traders from placing aggressive bets around the USD/JPY pair.
It is worth recalling that the minutes of the April BoJ meeting showed on Wednesday that the nine-member board saw the need to keep ultra-low interest rates to support the fragile domestic economy. Adding to this, BoJ policymaker Seiji Adachi brushed aside expectations of an early tweak in the yield curve control policy and said that it was too early to phase out ultra-loose monetary policy due to uncertainty over the price outlook.
This marks a big divergence in comparison to the Fed projections for a higher peak interest rate this year and suggests that the path of least resistance for the USD/JPY pair is to the upside. Hence, any meaningful corrective decline is more likely to attract fresh buyers at lower levels and remain limited. Investors now look to Powell’s second day of congressional testimony, which, along with the US macro data, might provide some impetus to the major.
Technical Levels: Supports and Resistances
USDJPY currently trading at 141.81 at the time of writing. Pair opened at 141.88 and is trading with a change of -0.05 % .
| Overview | Overview.1 | |
|---|---|---|
| 0 | Today last price | 141.81 |
| 1 | Today Daily Change | -0.07 |
| 2 | Today Daily Change % | -0.05 |
| 3 | Today daily open | 141.88 |
The pair remains strongly bullish on the daily timeframe. It trades above its 20 SMA @ 140.21, 50 SMA 137.4, 100 SMA @ 135.37 and 200 SMA @ 137.21.
| Trends | Trends.1 | |
|---|---|---|
| 0 | Daily SMA20 | 140.21 |
| 1 | Daily SMA50 | 137.40 |
| 2 | Daily SMA100 | 135.37 |
| 3 | Daily SMA200 | 137.21 |
The previous day high was 142.37 while the previous day low was 141.28. The daily 38.2% Fib levels comes at 141.95, expected to provide resistance. Similarly, the daily 61.8% fib level is at 141.7, expected to provide support.
Note the levels of interest below:
- Pivot support is noted at 141.32, 140.76, 140.24
- Pivot resistance is noted at 142.41, 142.93, 143.49
| Levels | Levels.1 |
|---|---|
| Previous Daily High | 142.37 |
| Previous Daily Low | 141.28 |
| Previous Weekly High | 141.92 |
| Previous Weekly Low | 139.01 |
| Previous Monthly High | 140.93 |
| Previous Monthly Low | 133.50 |
| Daily Fibonacci 38.2% | 141.95 |
| Daily Fibonacci 61.8% | 141.70 |
| Daily Pivot Point S1 | 141.32 |
| Daily Pivot Point S2 | 140.76 |
| Daily Pivot Point S3 | 140.24 |
| Daily Pivot Point R1 | 142.41 |
| Daily Pivot Point R2 | 142.93 |
| Daily Pivot Point R3 | 143.49 |
[/s2If]
Nehcap Expert Advisor
The NEHCAP MT4 EA is high quality professional trading system geared to generate returns without using GRID or martingales. Each trade has strict risk per trade parameter. The pairs under management include EURUSD, GBPUSD, AUDCAD, AUDNZD,GBPAUD, EURAUD, EURCAD, CHFJPY and many more.
The system is trading live: LIVE ACCOUNT TRACKING
You can run it free. Apply for a free trial and track our account. Buy the system or use profit share mechanism to generate returns on your MT4.
Join Our Telegram Group
")


