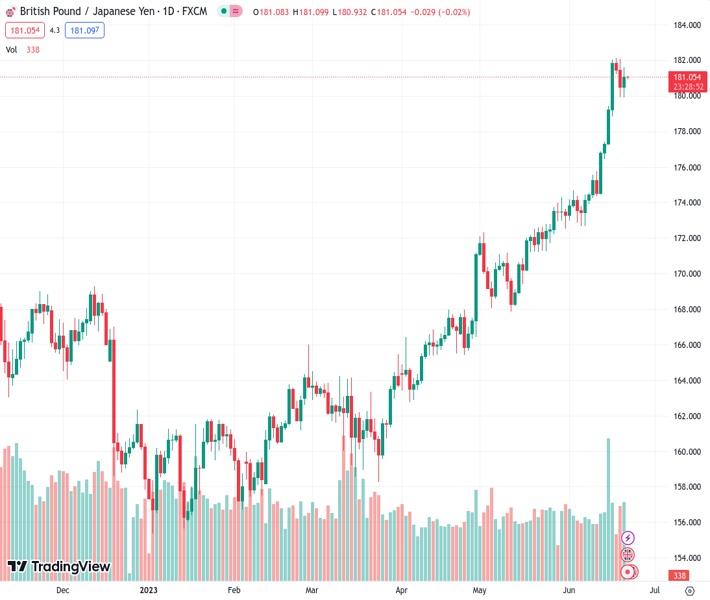
During the day on Wednesday, the currency pair of GBPJPY had fluctuations within the range of 179.93 to 181.61. Currently, it stands at 181.003.
…
This is a premium post.
[s2If !current_user_can(access_s2member_level4)]Please register for FREE REGISTER to read full post below containing analysis. In case of any error or you think you are not able to read the full post below, please email us at support#nehcap.com [lwa][/s2If] [s2If current_user_can(access_s2member_level1)]
- On Wednesday’s session, the GBP/JPY traded in the 179.93 – 181.61 range.
The pair currently trades last at 181.003.
The previous day high was 182.1 while the previous day low was 179.93. The daily 38.2% Fib levels comes at 180.76, expected to provide support. Similarly, the daily 61.8% fib level is at 181.27, expected to provide resistance.
The GBP/JPY cross trades with gains on Wednesday as hot inflation figures from the UK fueled a rise in the British Gilts, resulting in gains on the GBP ahead of Bank of England’s (BoE) monetary policy decision on Thursday. On the other hand, the Yen lost ground after the Bank of Japan (BoJ) minutes revealed that members consider it appropriate to maintain its dovish stance.
On Wednesday, the Office for National Statistics from the UK released that inflation, as per the Consumer Price Index (CPI), rose to 8.7% YoY in May vs 8.4% and from its previous figure of 8.7% in April. In addition, the Core figure accelerated to 7.1%, above the 6.8% expected and from the last reading of 6.8%.
Considering this, the British yields are seeing gains across the curve. The 10-year bond yield rose to 4.48%, while the 2-year yield stands at 5.15% and the 5-year at 4.68%, respectively. That being said, the stronger case for BoE’s Thursday decision is a 25 basis point (bps) hike, which is only near 15% odds of a bigger hike of 50 bps as per World Interest Rate Possibilities (WIRP). In addition, eyes will be on the updated macroeconomic forecast and the vote split of the Monetary Police Committee (MPC).
On the other hand, following the release of the dovish minutes from April’s BoJ meeting, eyes are set on Friday’s inflation figures from Japan. In that sense, economists anticipate a year-on-year increase in the CPI to reach 4.1%, surpassing the previous reading of 3.5%. Additionally, the Core inflation rate, which factors out the impact of oil and food prices, is projected to rise from the previous figure of 4.1% to 4.4%.
According to the daily chart, the GBP/JPY holds a bullish outlook for the short term. The Relative Strength Index (RSI) and Moving Average Convergence Divergence (MACD) suggest that buyers are in control while the pair trades above its main moving averages.
Upcoming resistance for GBP/JPY is seen at the daily low of 181.60, followed by the zone at 182.00 and the cycle low at 182.12. On the other hand,The 180.50 area level is key for GBP/JPY to maintain its upside bias. If breached, the price could see a steeper decline towards the 179.90 zone and 179.50 level
Technical Levels: Supports and Resistances
GBPJPY currently trading at 181.08 at the time of writing. Pair opened at 180.57 and is trading with a change of 0.28 % .
| Overview | Overview.1 | |
|---|---|---|
| 0 | Today last price | 181.08 |
| 1 | Today Daily Change | 0.51 |
| 2 | Today Daily Change % | 0.28 |
| 3 | Today daily open | 180.57 |
The pair remains strongly bullish on the daily timeframe. It trades above its 20 SMA @ 175.53, 50 SMA 171.63, 100 SMA @ 166.81 and 200 SMA @ 165.27.
| Trends | Trends.1 | |
|---|---|---|
| 0 | Daily SMA20 | 175.53 |
| 1 | Daily SMA50 | 171.63 |
| 2 | Daily SMA100 | 166.81 |
| 3 | Daily SMA200 | 165.27 |
The previous day high was 182.1 while the previous day low was 179.93. The daily 38.2% Fib levels comes at 180.76, expected to provide support. Similarly, the daily 61.8% fib level is at 181.27, expected to provide resistance.
Note the levels of interest below:
- Pivot support is noted at 179.63, 178.7, 177.47
- Pivot resistance is noted at 181.8, 183.03, 183.97
| Levels | Levels.1 |
|---|---|
| Previous Daily High | 182.10 |
| Previous Daily Low | 179.93 |
| Previous Weekly High | 182.04 |
| Previous Weekly Low | 174.36 |
| Previous Monthly High | 174.28 |
| Previous Monthly Low | 167.84 |
| Daily Fibonacci 38.2% | 180.76 |
| Daily Fibonacci 61.8% | 181.27 |
| Daily Pivot Point S1 | 179.63 |
| Daily Pivot Point S2 | 178.70 |
| Daily Pivot Point S3 | 177.47 |
| Daily Pivot Point R1 | 181.80 |
| Daily Pivot Point R2 | 183.03 |
| Daily Pivot Point R3 | 183.97 |
[/s2If]
Nehcap Expert Advisor
The NEHCAP MT4 EA is high quality professional trading system geared to generate returns without using GRID or martingales. Each trade has strict risk per trade parameter. The pairs under management include EURUSD, GBPUSD, AUDCAD, AUDNZD,GBPAUD, EURAUD, EURCAD, CHFJPY and many more.
The system is trading live: LIVE ACCOUNT TRACKING
You can run it free. Apply for a free trial and track our account. Buy the system or use profit share mechanism to generate returns on your MT4.
Join Our Telegram Group
")


