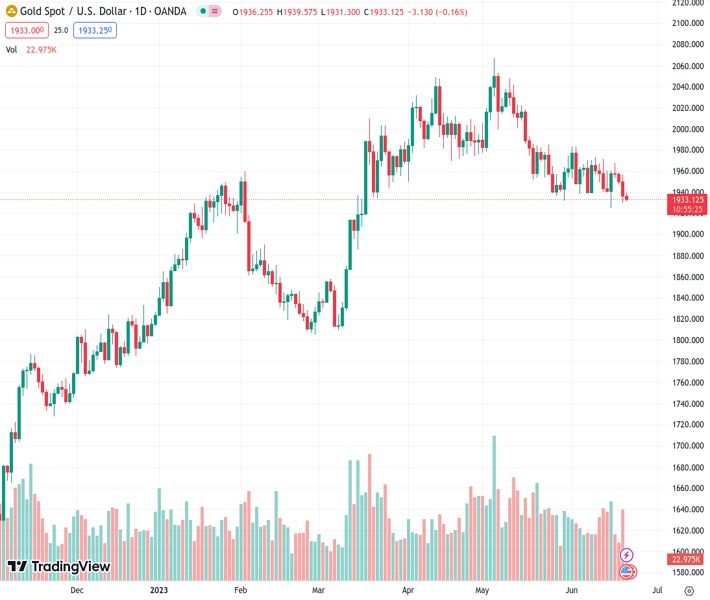
It is anticipated that the value of gold, currently at 1,933.10 in the XAU/USD market, will continue to decrease and fall below $1,930.00 in anticipation of Fed Powell’s testimony.
…
This is a premium post.
[s2If !current_user_can(access_s2member_level4)]Please register for FREE REGISTER to read full post below containing analysis. In case of any error or you think you are not able to read the full post below, please email us at support#nehcap.com [lwa][/s2If] [s2If current_user_can(access_s2member_level1)]
- Gold price is expected to extend its downside journey below $1,930.00 ahead of Fed Powell’s testimony.
The pair currently trades last at 1933.10.
The previous day high was 1956.86 while the previous day low was 1929.82. The daily 38.2% Fib levels comes at 1940.15, expected to provide resistance. Similarly, the daily 61.8% fib level is at 1946.53, expected to provide resistance.
Gold price (XAU/USD) has concluded its less-confident pullback move to near $1,940.00 in the European session. The precious metal is expected to show further downside below $1930.00 as US Treasury yields have shown resilience ahead of Federal Reserve (Fed) chair Jerome Powell’s testimony.
S&P500 futures have turned flat after choppy moves as investors have sidelined ahead of Fed Powell’s testimony. The US Dollar Index (DXY) is showing topsy-turvy moves around 102.60. A volatile action is anticipated from the USD Index as the street is mixed in Fed’s 50 basis points (bps) interest rate hike vs. data-dependent approach. Contrary to the choppy USD Index, US Treasury yields look firmer. The 10-year US Treasury yields are holding above 3.74%.
Going forward, the entire focus will be on Jerome Powell’s words. Economists at ING believe the first week of July is when we’ll get the most important set of data releases in the United States, so Powell’s words can determine whether DXY will end the quarter above or below the 102.00 mark.
Later this week, US weekly jobless claims data will remain in focus. The US Department of Labor has reported higher-than-anticipated first-timer jobless claims straight for the past three weeks. Further jump in claims would convey that labor market conditions are easing further.
Gold price is on edge of the horizontal support of the Descending Triangle chart pattern formed on a two-hour scale, which is placed from May 30 low at $1,932.12. The downward-sloping trendline of the aforementioned chart pattern is plotted from June 02 high at $1,983.00. The 200-period Exponential Moving Average (EMA) at $1,958.84 is acting as a barricade for the Gold bulls. Horizontal resistance is plotted from May 05 low around $2,000.00.
The Relative Strength Index (RSI) (14) has slipped into the bearish range of 20.00-40.00, which indicates that the downside momentum has been triggered.
Technical Levels: Supports and Resistances
XAUUSD currently trading at 1933.41 at the time of writing. Pair opened at 1936.4 and is trading with a change of -0.15 % .
| Overview | Overview.1 | |
|---|---|---|
| 0 | Today last price | 1933.41 |
| 1 | Today Daily Change | -2.99 |
| 2 | Today Daily Change % | -0.15 |
| 3 | Today daily open | 1936.40 |
The pair is trading below its 20 Daily moving average @ 1953.76, below its 50 Daily moving average @ 1983.15 , below its 100 Daily moving average @ 1942.45 and above its 200 Daily moving average @ 1849.86
| Trends | Trends.1 | |
|---|---|---|
| 0 | Daily SMA20 | 1953.76 |
| 1 | Daily SMA50 | 1983.15 |
| 2 | Daily SMA100 | 1942.45 |
| 3 | Daily SMA200 | 1849.86 |
The previous day high was 1956.86 while the previous day low was 1929.82. The daily 38.2% Fib levels comes at 1940.15, expected to provide resistance. Similarly, the daily 61.8% fib level is at 1946.53, expected to provide resistance.
Note the levels of interest below:
- Pivot support is noted at 1925.19, 1913.99, 1898.15
- Pivot resistance is noted at 1952.23, 1968.07, 1979.27
| Levels | Levels.1 |
|---|---|
| Previous Daily High | 1956.86 |
| Previous Daily Low | 1929.82 |
| Previous Weekly High | 1971.01 |
| Previous Weekly Low | 1924.85 |
| Previous Monthly High | 2079.76 |
| Previous Monthly Low | 1932.12 |
| Daily Fibonacci 38.2% | 1940.15 |
| Daily Fibonacci 61.8% | 1946.53 |
| Daily Pivot Point S1 | 1925.19 |
| Daily Pivot Point S2 | 1913.99 |
| Daily Pivot Point S3 | 1898.15 |
| Daily Pivot Point R1 | 1952.23 |
| Daily Pivot Point R2 | 1968.07 |
| Daily Pivot Point R3 | 1979.27 |
[/s2If]
Nehcap Expert Advisor
The NEHCAP MT4 EA is high quality professional trading system geared to generate returns without using GRID or martingales. Each trade has strict risk per trade parameter. The pairs under management include EURUSD, GBPUSD, AUDCAD, AUDNZD,GBPAUD, EURAUD, EURCAD, CHFJPY and many more.
The system is trading live: LIVE ACCOUNT TRACKING
You can run it free. Apply for a free trial and track our account. Buy the system or use profit share mechanism to generate returns on your MT4.
Join Our Telegram Group
")


