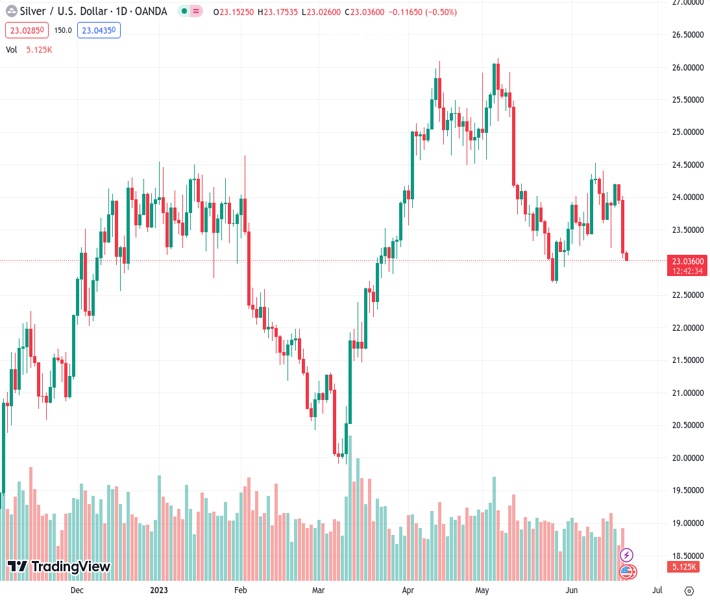
Silver at a rate of 23.035 USD is believed to be stabilizing after a decrease during the night, reaching a new low for the month.
…
This is a premium post.
[s2If !current_user_can(access_s2member_level4)]Please register for FREE REGISTER to read full post below containing analysis. In case of any error or you think you are not able to read the full post below, please email us at support#nehcap.com [lwa][/s2If] [s2If current_user_can(access_s2member_level1)]
- Silver is seen consolidating the overnight slump to a fresh monthly low.
The pair currently trades last at 23.035.
The previous day high was 24.03 while the previous day low was 23.06. The daily 38.2% Fib levels comes at 23.43, expected to provide resistance. Similarly, the daily 61.8% fib level is at 23.66, expected to provide resistance.
Silver enters a bearish consolidation phase on Wednesday and oscillates in a narrow trading band just above the $23.00 mark, or a fresh monthly low touched the previous day.
From a technical perspective, the recent repeated failures to find acceptance above the 200-period Simple Moving Average (SMA), followed by the overnight slump favour bearish traders. Moreover, oscillators on the daily chart have again started drifting into negative territory. That said, the Relative Strength Index (RSI) on hourly charts flash oversold conditions and warrants some caution before positioning for any further slide. Nevertheless, the XAG/USD seems vulnerable to adding to its weekly losses registered over the past two days.
A sustained break and acceptance below the $23.00 mark will reaffirm the negative outlook and drag the white metal towards testing the May monthly swing low, around the $22.70-$22.65 region. This is followed by the very important 200-day SMA, currently around the $22.40-$22.35 area. Failure to defend the latter will mark a fresh bearish breakdown and expose the $22.00 round-figure mark. The downward trajectory could get extended further towards the next relevant support near the $21.50-$21.45 horizontal zone en route to the $21.00 round figure.
On the flip side, the $23.60-$23.65 region now seems to act as an immediate hurdle ahead of the 200-period SMA on the 4-hour chart, around the $23.90 area. Some follow-through buying beyond the $24.00 mark might trigger a short-covering move and lift the XAU/USD towards the $24.50-$24.55 zone, or the monthly peak touched last week. The latter should act as a pivotal point, which if cleared decisively should allow bulls to reclaim the $25.00 psychological mark and test the $25.30-$25.40 resistance zone.
Technical Levels: Supports and Resistances
XAGUSD currently trading at 23.04 at the time of writing. Pair opened at 23.18 and is trading with a change of -0.6 % .
| Overview | Overview.1 | |
|---|---|---|
| 0 | Today last price | 23.04 |
| 1 | Today Daily Change | -0.14 |
| 2 | Today Daily Change % | -0.60 |
| 3 | Today daily open | 23.18 |
The pair is trading below its 20 Daily moving average @ 23.63, below its 50 Daily moving average @ 24.37 , below its 100 Daily moving average @ 23.36 and above its 200 Daily moving average @ 22.44
| Trends | Trends.1 | |
|---|---|---|
| 0 | Daily SMA20 | 23.63 |
| 1 | Daily SMA50 | 24.37 |
| 2 | Daily SMA100 | 23.36 |
| 3 | Daily SMA200 | 22.44 |
The previous day high was 24.03 while the previous day low was 23.06. The daily 38.2% Fib levels comes at 23.43, expected to provide resistance. Similarly, the daily 61.8% fib level is at 23.66, expected to provide resistance.
Note the levels of interest below:
- Pivot support is noted at 22.81, 22.45, 21.84
- Pivot resistance is noted at 23.78, 24.39, 24.75
| Levels | Levels.1 |
|---|---|
| Previous Daily High | 24.03 |
| Previous Daily Low | 23.06 |
| Previous Weekly High | 24.40 |
| Previous Weekly Low | 23.22 |
| Previous Monthly High | 26.14 |
| Previous Monthly Low | 22.68 |
| Daily Fibonacci 38.2% | 23.43 |
| Daily Fibonacci 61.8% | 23.66 |
| Daily Pivot Point S1 | 22.81 |
| Daily Pivot Point S2 | 22.45 |
| Daily Pivot Point S3 | 21.84 |
| Daily Pivot Point R1 | 23.78 |
| Daily Pivot Point R2 | 24.39 |
| Daily Pivot Point R3 | 24.75 |
[/s2If]
Nehcap Expert Advisor
The NEHCAP MT4 EA is high quality professional trading system geared to generate returns without using GRID or martingales. Each trade has strict risk per trade parameter. The pairs under management include EURUSD, GBPUSD, AUDCAD, AUDNZD,GBPAUD, EURAUD, EURCAD, CHFJPY and many more.
The system is trading live: LIVE ACCOUNT TRACKING
You can run it free. Apply for a free trial and track our account. Buy the system or use profit share mechanism to generate returns on your MT4.
Join Our Telegram Group
")


