The GBPJPY pair has experienced its first daily increase in three days following the release of UK inflation data, which has brought an end to its two-day losing trend. According to the opinion of @nehcap, it is anticipated that there will be additional positive movement.
…
This is a premium post.
[s2If !current_user_can(access_s2member_level4)]Please register for FREE REGISTER to read full post below containing analysis. In case of any error or you think you are not able to read the full post below, please email us at support#nehcap.com [lwa][/s2If] [s2If current_user_can(access_s2member_level1)]
- GBP/JPY prints the first daily gains in three after UK inflation data, snaps two-day losing streak.
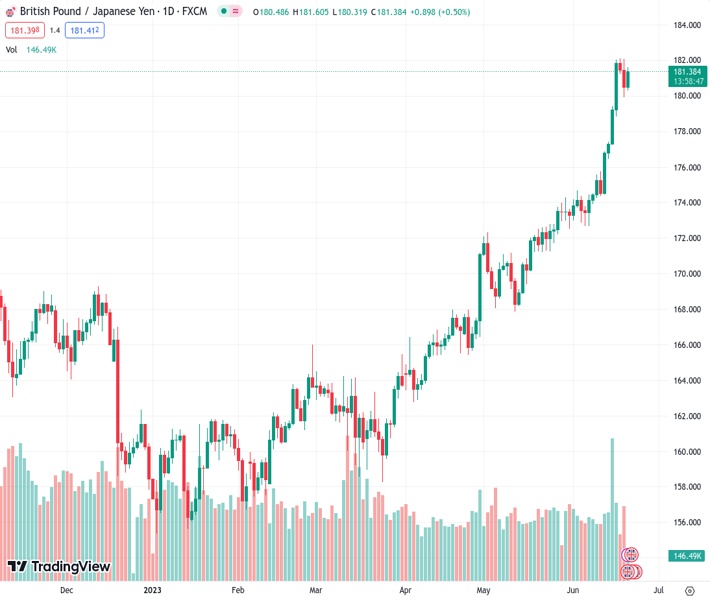
The pair currently trades last at 181.478.
The previous day high was 182.1 while the previous day low was 179.93. The daily 38.2% Fib levels comes at 180.76, expected to provide support. Similarly, the daily 61.8% fib level is at 181.27, expected to provide support.
GBP/JPY justifies upbeat UK inflation data to regain upside momentum, snapping two-day downtrend, amid early Wednesday morning in London. That said, the cross-currency pair jumps 80 pips to refresh its intraday high near 181.60 before recently making rounds to the mid-181.00s.
UK Consumer Price Index (CPI) for May rose past 8.4% market expectations to reprint the 8.7% YoY figure. That said, the Core CPI, which excludes volatile food and energy items, rose past analysts’ estimations and previous readings of 6.8% YoY to register a 7.1% YoY increase in inflation numbers for the said month.
Apart from the UK inflation data, the GBP/JPY pair’s clear rebound from the 100-Hour Moving Average (HMA), around 180.60 by the press time, joins the bullish MACD signal to also keep the pair buyers hopeful.
It’s worth noting, however, that the RSI (14) line approaches the overbought territory and hence a downward-sloping trend line from Monday, close to the 182.00 round figure, appears a tough nut to crack for the bulls.
In addition to the 182.00 hurdle, the latest multi-month high of near 182.15 also acts as an upside filter for the GBP/JPY pair before directing it towards the December 2015 peak of around 186.35.
Alternatively, a downside break of the 100-HMA level of near 180.60 will need validation from the 180.00 round figure and the latest swing low of 179.90 to convince intraday sellers.
Even so, the 200-HMA and a two-week-old rising support line, respectively near 178.15 and 177.65, will challenge the GBP/JPY bears before giving them control.
Trend: Further upside expected
Technical Levels: Supports and Resistances
GBPJPY currently trading at 181.5 at the time of writing. Pair opened at 180.57 and is trading with a change of 0.52% % .
| Overview | Overview.1 | |
|---|---|---|
| 0 | Today last price | 181.5 |
| 1 | Today Daily Change | 0.93 |
| 2 | Today Daily Change % | 0.52% |
| 3 | Today daily open | 180.57 |
The pair remains strongly bullish on the daily timeframe. It trades above its 20 SMA @ 175.53, 50 SMA 171.63, 100 SMA @ 166.81 and 200 SMA @ 165.27.
| Trends | Trends.1 | |
|---|---|---|
| 0 | Daily SMA20 | 175.53 |
| 1 | Daily SMA50 | 171.63 |
| 2 | Daily SMA100 | 166.81 |
| 3 | Daily SMA200 | 165.27 |
The previous day high was 182.1 while the previous day low was 179.93. The daily 38.2% Fib levels comes at 180.76, expected to provide support. Similarly, the daily 61.8% fib level is at 181.27, expected to provide support.
Note the levels of interest below:
- Pivot support is noted at 179.63, 178.7, 177.47
- Pivot resistance is noted at 181.8, 183.03, 183.97
| Levels | Levels.1 |
|---|---|
| Previous Daily High | 182.10 |
| Previous Daily Low | 179.93 |
| Previous Weekly High | 182.04 |
| Previous Weekly Low | 174.36 |
| Previous Monthly High | 174.28 |
| Previous Monthly Low | 167.84 |
| Daily Fibonacci 38.2% | 180.76 |
| Daily Fibonacci 61.8% | 181.27 |
| Daily Pivot Point S1 | 179.63 |
| Daily Pivot Point S2 | 178.70 |
| Daily Pivot Point S3 | 177.47 |
| Daily Pivot Point R1 | 181.80 |
| Daily Pivot Point R2 | 183.03 |
| Daily Pivot Point R3 | 183.97 |
[/s2If]
Nehcap Expert Advisor
The NEHCAP MT4 EA is high quality professional trading system geared to generate returns without using GRID or martingales. Each trade has strict risk per trade parameter. The pairs under management include EURUSD, GBPUSD, AUDCAD, AUDNZD,GBPAUD, EURAUD, EURCAD, CHFJPY and many more.
The system is trading live: LIVE ACCOUNT TRACKING
You can run it free. Apply for a free trial and track our account. Buy the system or use profit share mechanism to generate returns on your MT4.
Join Our Telegram Group
")


