The AUDUSD pair, currently trading at 0.67940, has made minor progress in recovering from its most substantial daily decline in a month, thus ending a three-day losing streak. However, it is expected that this recovery will be minimal according to the view of @nehcap.
…
This is a premium post.
[s2If !current_user_can(access_s2member_level4)]Please register for FREE REGISTER to read full post below containing analysis. In case of any error or you think you are not able to read the full post below, please email us at support#nehcap.com [lwa][/s2If] [s2If current_user_can(access_s2member_level1)]
- AUD/USD prints mild gains to pare the biggest daily loss in a month, snaps three-day losing streak.
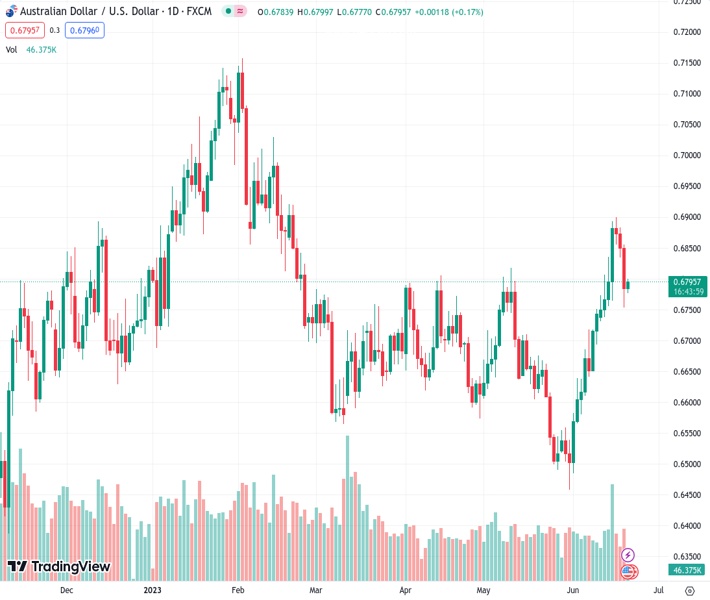
The pair currently trades last at 0.67940.
The previous day high was 0.6855 while the previous day low was 0.6753. The daily 38.2% Fib levels comes at 0.6792, expected to provide support. Similarly, the daily 61.8% fib level is at 0.6816, expected to provide resistance.
AUD/USD bulls struggle to regain the 0.6800 round figure while printing mild gains around the intraday high of 0.6799 heading into Wednesday’s European session. In doing so, the Aussie pair prints the first daily gains in four while bouncing off the 200-day Exponential Moving Average (EMA).
However, the previous day’s clean rejection of the three-week-old bullish channel keeps the AUD/USD sellers hopeful unless the quote rises past the stated channel’s lower line, close to 0.6890 by the press time.
Also acting as the upside filter is the 0.6900 round figure and the top line of the aforementioned rising channel, near the 0.7000 threshold.
It’s worth noting that the MACD signals are still bullish and the RSI (14) line suggests a continuation of the latest rebound by staying above 50.0 but not overbought.
As a result, the AUD/USD buyers may keep the reins unless the quote stays beyond the 200-EMA level of 0.6760.
Even if the quote drops below 0.6760, the 50% Fibonacci retracement level of 0.6665 and the lows marked in April and March, respectively near 0.6575 and 0.6565, can test the AUD/USD bears before giving them control.
Fundamentally, the AUD/USD pair faces multiple challenges from the Fed and China concerns.
Also read: AUD/USD pares weekly losses around 0.6800 as markets brace for Fed Chair Powell’s testimony
Trend: Limited recovery expected
Technical Levels: Supports and Resistances
AUDUSD currently trading at 0.6789 at the time of writing. Pair opened at 0.6785 and is trading with a change of 0.06% % .
| Overview | Overview.1 | |
|---|---|---|
| 0 | Today last price | 0.6789 |
| 1 | Today Daily Change | 0.0004 |
| 2 | Today Daily Change % | 0.06% |
| 3 | Today daily open | 0.6785 |
The pair remains strongly bullish on the daily timeframe. It trades above its 20 SMA @ 0.667, 50 SMA 0.6679, 100 SMA @ 0.6723 and 200 SMA @ 0.6692.
| Trends | Trends.1 | |
|---|---|---|
| 0 | Daily SMA20 | 0.6670 |
| 1 | Daily SMA50 | 0.6679 |
| 2 | Daily SMA100 | 0.6723 |
| 3 | Daily SMA200 | 0.6692 |
The previous day high was 0.6855 while the previous day low was 0.6753. The daily 38.2% Fib levels comes at 0.6792, expected to provide support. Similarly, the daily 61.8% fib level is at 0.6816, expected to provide resistance.
Note the levels of interest below:
- Pivot support is noted at 0.674, 0.6696, 0.6638
- Pivot resistance is noted at 0.6842, 0.69, 0.6945
| Levels | Levels.1 |
|---|---|
| Previous Daily High | 0.6855 |
| Previous Daily Low | 0.6753 |
| Previous Weekly High | 0.6900 |
| Previous Weekly Low | 0.6732 |
| Previous Monthly High | 0.6818 |
| Previous Monthly Low | 0.6458 |
| Daily Fibonacci 38.2% | 0.6792 |
| Daily Fibonacci 61.8% | 0.6816 |
| Daily Pivot Point S1 | 0.6740 |
| Daily Pivot Point S2 | 0.6696 |
| Daily Pivot Point S3 | 0.6638 |
| Daily Pivot Point R1 | 0.6842 |
| Daily Pivot Point R2 | 0.6900 |
| Daily Pivot Point R3 | 0.6945 |
[/s2If]
Nehcap Expert Advisor
The NEHCAP MT4 EA is high quality professional trading system geared to generate returns without using GRID or martingales. Each trade has strict risk per trade parameter. The pairs under management include EURUSD, GBPUSD, AUDCAD, AUDNZD,GBPAUD, EURAUD, EURCAD, CHFJPY and many more.
The system is trading live: LIVE ACCOUNT TRACKING
You can run it free. Apply for a free trial and track our account. Buy the system or use profit share mechanism to generate returns on your MT4.
Join Our Telegram Group
")


