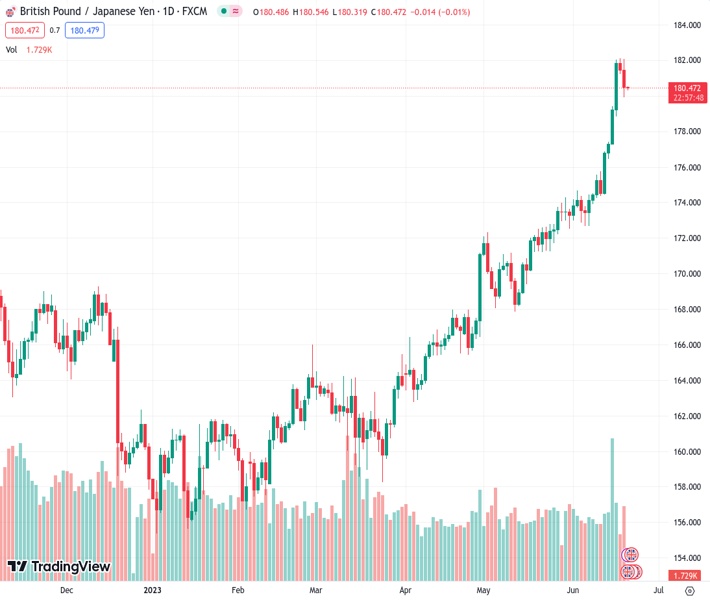
The GBPJPY pair experienced a decline for two days in a row as it traded within the range of 179.93 to 182.09, with its latest trade at 180.472.
…
This is a premium post.
[s2If !current_user_can(access_s2member_level4)]Please register for FREE REGISTER to read full post below containing analysis. In case of any error or you think you are not able to read the full post below, please email us at support#nehcap.com [lwa][/s2If] [s2If current_user_can(access_s2member_level1)]
- The GBP/JPY traded in the 179.93 – 182.09 range, setting a second consecutive day of losses.
The pair currently trades last at 180.472.
The previous day high was 182.14 while the previous day low was 181.22. The daily 38.2% Fib levels comes at 181.57, expected to provide resistance. Similarly, the daily 61.8% fib level is at 181.79, expected to provide resistance.
On Tuesday, the GBP/JPY pair suffered losses as the Yen gained traction on the back of Bank of Japan rumours to intervene in the market to bolster the domestic currency. On the other hand, investors await UK’s inflation data at the early London trading hour’s ahead of the Bank of England’s (BoE) decision on Thursday.
According to a Reuters poll, most economists anticipate that Japan’s government and the BoJ will intervene if the Japanese Yen weakens and reaches 145 per U.S. Dollar. Market participants will closely watch for any hints of intervention in the June BoJ meeting minutes, scheduled for release early on Wednesday in the Asian session.
On the other hand, The UK National Statistics Office is set to release the May CPI figures on Wednesday. Expectations suggest a slight deceleration, with the headline figure anticipated at 8.5% compared to the previous 8.7%. Additionally, a 0.4% monthly increase is expected for May. The Core figure is projected to remain unchanged at a year-on-year rate of 6.8%.
For Thursday’s BoE’s decision, a 25 basis point (bps) rate hike is already priced in, so inflation data may strengthen or weaken the case for a larger increase of 50 bps. In addition, eyes will be on Governer Andrew Bailey’s presser, where market participants will look for clues regarding the next monetary policy decision. As for now, investors anticipate 25 bps hikes in August, September, November, and December. These hikes would potentially bring the policy rate to a peak of around 5.75%.
The GBP/JPY currently exhibits a neutral to bearish bias in the short term. Although the bulls have lost some momentum, technical indicators continue to show positive signals, implying the potential for further upward movement in the market.
If GBP/JPY manages to regain momentum, the next resistances to watch are at the 181.00 area, followed by the 181.50 zone and the cycle high at 182.12. On the other hand, in case the cross loses more ground, support levels line up at the nearest round levels at the 180.50 area and below the psychological mark at 180.00 and the 179.50 zone.
Technical Levels: Supports and Resistances
GBPJPY currently trading at 180.46 at the time of writing. Pair opened at 181.61 and is trading with a change of -0.63 % .
| Overview | Overview.1 | |
|---|---|---|
| 0 | Today last price | 180.46 |
| 1 | Today Daily Change | -1.15 |
| 2 | Today Daily Change % | -0.63 |
| 3 | Today daily open | 181.61 |
The pair remains strongly bullish on the daily timeframe. It trades above its 20 SMA @ 175.1, 50 SMA 171.34, 100 SMA @ 166.61 and 200 SMA @ 165.2.
| Trends | Trends.1 | |
|---|---|---|
| 0 | Daily SMA20 | 175.10 |
| 1 | Daily SMA50 | 171.34 |
| 2 | Daily SMA100 | 166.61 |
| 3 | Daily SMA200 | 165.20 |
The previous day high was 182.14 while the previous day low was 181.22. The daily 38.2% Fib levels comes at 181.57, expected to provide resistance. Similarly, the daily 61.8% fib level is at 181.79, expected to provide resistance.
Note the levels of interest below:
- Pivot support is noted at 181.18, 180.75, 180.27
- Pivot resistance is noted at 182.09, 182.57, 183.0
| Levels | Levels.1 |
|---|---|
| Previous Daily High | 182.14 |
| Previous Daily Low | 181.22 |
| Previous Weekly High | 182.04 |
| Previous Weekly Low | 174.36 |
| Previous Monthly High | 174.28 |
| Previous Monthly Low | 167.84 |
| Daily Fibonacci 38.2% | 181.57 |
| Daily Fibonacci 61.8% | 181.79 |
| Daily Pivot Point S1 | 181.18 |
| Daily Pivot Point S2 | 180.75 |
| Daily Pivot Point S3 | 180.27 |
| Daily Pivot Point R1 | 182.09 |
| Daily Pivot Point R2 | 182.57 |
| Daily Pivot Point R3 | 183.00 |
[/s2If]
Nehcap Expert Advisor
The NEHCAP MT4 EA is high quality professional trading system geared to generate returns without using GRID or martingales. Each trade has strict risk per trade parameter. The pairs under management include EURUSD, GBPUSD, AUDCAD, AUDNZD,GBPAUD, EURAUD, EURCAD, CHFJPY and many more.
The system is trading live: LIVE ACCOUNT TRACKING
You can run it free. Apply for a free trial and track our account. Buy the system or use profit share mechanism to generate returns on your MT4.
Join Our Telegram Group
")


