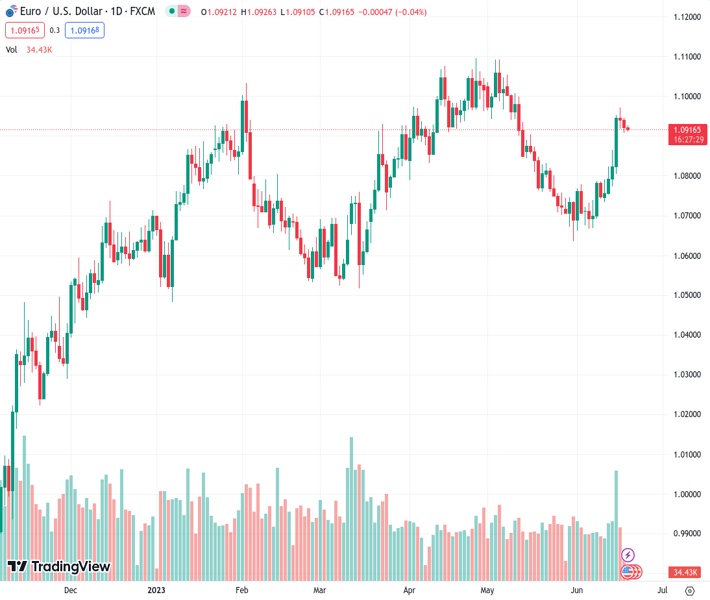
The EURUSD currency pair at 1.09187 does not have a clear direction during intraday trading and is moving within a set range during the Asian trading session.
…
This is a premium post.
[s2If !current_user_can(access_s2member_level4)]Please register for FREE REGISTER to read full post below containing analysis. In case of any error or you think you are not able to read the full post below, please email us at support#nehcap.com [lwa][/s2If] [s2If current_user_can(access_s2member_level1)]
- EUR/USD lacks any firm intraday direction and oscillates in a range through the Asian session.
The pair currently trades last at 1.09187.
The previous day high was 1.0946 while the previous day low was 1.0907. The daily 38.2% Fib levels comes at 1.0922, expected to provide resistance. Similarly, the daily 61.8% fib level is at 1.0931, expected to provide resistance.
The EUR/USD pair struggles to gain any meaningful traction on Tuesday and oscillates in a narrow trading band, just above the 1.0900 round-figure mark through the Asian session.
The US Dollar (USD) builds on its recent bounce from over a one-month low touched last Friday and edges higher for the third successive day, which, in turn, is seen as a key factor acting as a headwind for the EUR/USD pair. The Federal Reserve (Fed), though skipped a rate hike last week, signalled that borrowing costs may still need to rise as much as 50 bps by the end of this year. The markets were quick to react and are now pricing in another 25-bps lift-off at the July FOMC meeting, which, in turn, triggers a fresh leg up in the US bond yields and lends some support to the buck.
Apart from this, a generally weaker tone around the equity markets further benefits the Greenback’s relative safe-haven status and contributes to capping the upside for the EUR/USD pair. Concerns about a global economic downturn, particularly in China, overshadow reports that China is considering a broad stimulus package to bolster economic support and continues to weigh on investors’ sentiment. Even a move by the People’s Bank of China, to cuts one-year and five-year Loan Prime Rates (LPRs) this Tuesday, does little to ease concerns or provide any meaningful impetus to the major.
The downside for the EUR/USD pair, however, seems cushioned, at least for the time being, in the wake of the European Central Bank’s (ECB) hawkish outlook. It is worth recalling that the ECB hiked interest rates for the eighth straight time last Wednesday, to the highest in 22 years and indicated that additional rate hikes will be needed to bring Eurozone inflation to its medium-term target of 2%. The inflation projection for this year was raised to 5.1% from 4.6%, suggesting that the central bank is still not done with its policy tightening. This, in turn, could offer support to the shared currency.
Traders also seem reluctant to place aggressive bets and might prefer to wait on the sidelines ahead of Fed Chair Jerome Powell’s two-day congressional testimony starting this Wednesday. Apart from this, comments by a slew of influential FOMC members will be looked upon for fresh cues about the Fed’s future rate-hike path, which will play a key role in driving the USD demand and help determine the near-term trajectory for the EUR/USD pair. Investors this week will also confront the release of the flash PMI prints from the Eurozone and the US, due on Friday.
Technical Levels: Supports and Resistances
EURUSD currently trading at 1.0917 at the time of writing. Pair opened at 1.0922 and is trading with a change of -0.05 % .
| Overview | Overview.1 | |
|---|---|---|
| 0 | Today last price | 1.0917 |
| 1 | Today Daily Change | -0.0005 |
| 2 | Today Daily Change % | -0.0500 |
| 3 | Today daily open | 1.0922 |
The pair remains strongly bullish on the daily timeframe. It trades above its 20 SMA @ 1.077, 50 SMA 1.088, 100 SMA @ 1.0808 and 200 SMA @ 1.0546.
| Trends | Trends.1 | |
|---|---|---|
| 0 | Daily SMA20 | 1.0770 |
| 1 | Daily SMA50 | 1.0880 |
| 2 | Daily SMA100 | 1.0808 |
| 3 | Daily SMA200 | 1.0546 |
The previous day high was 1.0946 while the previous day low was 1.0907. The daily 38.2% Fib levels comes at 1.0922, expected to provide resistance. Similarly, the daily 61.8% fib level is at 1.0931, expected to provide resistance.
Note the levels of interest below:
- Pivot support is noted at 1.0904, 1.0886, 1.0865
- Pivot resistance is noted at 1.0943, 1.0964, 1.0982
| Levels | Levels.1 |
|---|---|
| Previous Daily High | 1.0946 |
| Previous Daily Low | 1.0907 |
| Previous Weekly High | 1.0971 |
| Previous Weekly Low | 1.0733 |
| Previous Monthly High | 1.1092 |
| Previous Monthly Low | 1.0635 |
| Daily Fibonacci 38.2% | 1.0922 |
| Daily Fibonacci 61.8% | 1.0931 |
| Daily Pivot Point S1 | 1.0904 |
| Daily Pivot Point S2 | 1.0886 |
| Daily Pivot Point S3 | 1.0865 |
| Daily Pivot Point R1 | 1.0943 |
| Daily Pivot Point R2 | 1.0964 |
| Daily Pivot Point R3 | 1.0982 |
[/s2If]
Nehcap Expert Advisor
The NEHCAP MT4 EA is high quality professional trading system geared to generate returns without using GRID or martingales. Each trade has strict risk per trade parameter. The pairs under management include EURUSD, GBPUSD, AUDCAD, AUDNZD,GBPAUD, EURAUD, EURCAD, CHFJPY and many more.
The system is trading live: LIVE ACCOUNT TRACKING
You can run it free. Apply for a free trial and track our account. Buy the system or use profit share mechanism to generate returns on your MT4.
Join Our Telegram Group
")


