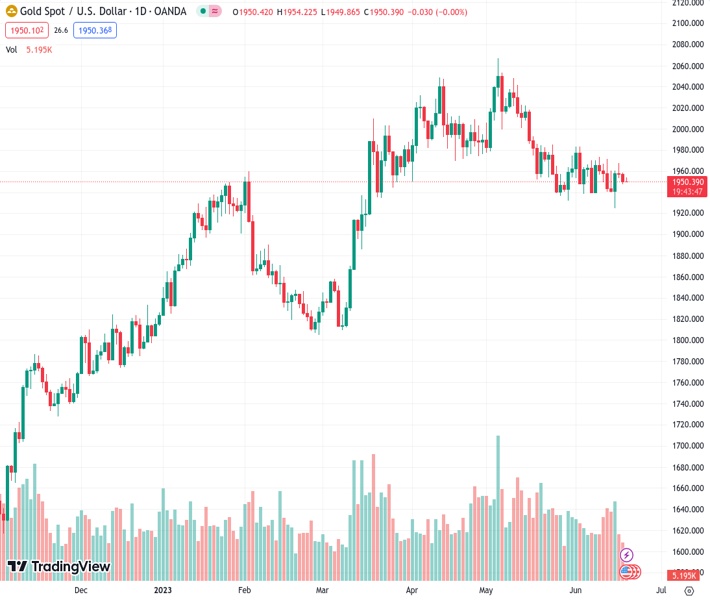
On Tuesday, during the Asian trading session, the price of gold remained within a tight trading range as it fluctuated around 1,949.99 for XAUUSD.
…
This is a premium post.
[s2If !current_user_can(access_s2member_level4)]Please register for FREE REGISTER to read full post below containing analysis. In case of any error or you think you are not able to read the full post below, please email us at support#nehcap.com [lwa][/s2If] [s2If current_user_can(access_s2member_level1)]
- Gold price oscillates in a narrow trading band through the Asian session on Tuesday.
The pair currently trades last at 1949.99.
The previous day high was 1958.85 while the previous day low was 1947.86. The daily 38.2% Fib levels comes at 1952.06, expected to provide resistance. Similarly, the daily 61.8% fib level is at 1954.65, expected to provide resistance.
Gold price struggles to capitalize on its modest intraday uptick and oscillates in a narrow trading band through the first half of the Asian session on Tuesday. The XAU/USD currently trades around the $1,950 level, nearly unchanged for the day, and remains well within a familiar trading range held over the past month or so.
The uncertainty over the Federal Reserve’s (Fed) rate-hike path is holding back traders from placing aggressive directional bets around the Gold price. It is worth recalling that the Fed signalled last week that borrowing costs may still need to rise by as much as 50 basis points (bps) by the end of this year. That said, the incoming softer macro data from the United States (US) raised questions over how much headroom the Fed has to keep raising rates. Hence, the focus will remain glued to Fed Chair Jerome Powell’s two-day congressional testimony, which will be scrutinized for fresh clues about the US central bank’s policy outlook and help determine the near-term trajectory for the XAU/USD.
In the meantime, the markets have been pricing in the possibility of another 25 bps lift-off in July as inflation in the US is still trending well above the central bank’s 2% annual target. This, along with a more hawkish outlook by other major central banks, caps the upside for the non-yielding Gold price. In fact, the Reserve Bank of Australia (RBA) and the Bank of Canada (BoC) delivered a surprise 25 bps rate hike earlier this month. Moreover, the European Central Bank (ECB) last week lifted rates to the highest level in 22 years and projected further tightening to bring down inflation. The Bank of England (BoE) and the Swiss National Bank (SNB) are also expected to hike interest rates by 25 bps later this week.
Apart from this, a modest US Dollar (USD) uptick, bolstered by a goodish pickup in the US Treasury bond yields, suggests that the path of least resistance for Gold price is to the downside. That said, worries about a global economic downturn continue to weigh on investors’ sentiment, which is evident from a generally weaker tone around the equity markets and could lend some support to the safe-haven XAU/USD. This, in turn, makes it prudent to wait for strong follow-through selling before traders start positioning for the resumption of the recent sharp retracement slide from the all-time high, around the $2,075-$2,080 region touched in May.
From a technical perspective, the 100-day Simple Moving Average (SMA), currently around the $1,942 area, is likely to protect the immediate downside ahead of the $1,932 region and the $1,925-$1,924 zone or the monthly swing low. Some follow-through selling will be seen as a fresh trigger for bearish traders and make the Gold price vulnerable to accelerate the fall towards the $1,900 round figure. The downward trajectory could get extended further towards the $1,876-$1,875 horizontal support before the XAU/USD eventually drops to the very important 200-day SMA, currently around the $1,839 region.
On the flip side, the $1,962-$1,964 region is likely to act as an immediate hurdle ahead of the $1,970-$1,972 supply zone. This is followed by the $1,983-$1,985 barrier, above which a bout of a short-covering should allow the Gold price to reclaim the $2,000 psychological mark and climb further towards the next relevant barrier near the $2,010-$2,012 region.
Technical Levels: Supports and Resistances
XAUUSD currently trading at 1950.9 at the time of writing. Pair opened at 1950.05 and is trading with a change of 0.04 % .
| Overview | Overview.1 | |
|---|---|---|
| 0 | Today last price | 1950.90 |
| 1 | Today Daily Change | 0.85 |
| 2 | Today Daily Change % | 0.04 |
| 3 | Today daily open | 1950.05 |
The pair is trading below its 20 Daily moving average @ 1955.7, below its 50 Daily moving average @ 1984.5 , above its 100 Daily moving average @ 1942.31 and above its 200 Daily moving average @ 1848.8
| Trends | Trends.1 | |
|---|---|---|
| 0 | Daily SMA20 | 1955.70 |
| 1 | Daily SMA50 | 1984.50 |
| 2 | Daily SMA100 | 1942.31 |
| 3 | Daily SMA200 | 1848.80 |
The previous day high was 1958.85 while the previous day low was 1947.86. The daily 38.2% Fib levels comes at 1952.06, expected to provide resistance. Similarly, the daily 61.8% fib level is at 1954.65, expected to provide resistance.
Note the levels of interest below:
- Pivot support is noted at 1945.66, 1941.26, 1934.67
- Pivot resistance is noted at 1956.65, 1963.24, 1967.64
| Levels | Levels.1 |
|---|---|
| Previous Daily High | 1958.85 |
| Previous Daily Low | 1947.86 |
| Previous Weekly High | 1971.01 |
| Previous Weekly Low | 1924.85 |
| Previous Monthly High | 2079.76 |
| Previous Monthly Low | 1932.12 |
| Daily Fibonacci 38.2% | 1952.06 |
| Daily Fibonacci 61.8% | 1954.65 |
| Daily Pivot Point S1 | 1945.66 |
| Daily Pivot Point S2 | 1941.26 |
| Daily Pivot Point S3 | 1934.67 |
| Daily Pivot Point R1 | 1956.65 |
| Daily Pivot Point R2 | 1963.24 |
| Daily Pivot Point R3 | 1967.64 |
[/s2If]
Nehcap Expert Advisor
The NEHCAP MT4 EA is high quality professional trading system geared to generate returns without using GRID or martingales. Each trade has strict risk per trade parameter. The pairs under management include EURUSD, GBPUSD, AUDCAD, AUDNZD,GBPAUD, EURAUD, EURCAD, CHFJPY and many more.
The system is trading live: LIVE ACCOUNT TRACKING
You can run it free. Apply for a free trial and track our account. Buy the system or use profit share mechanism to generate returns on your MT4.
Join Our Telegram Group
")


