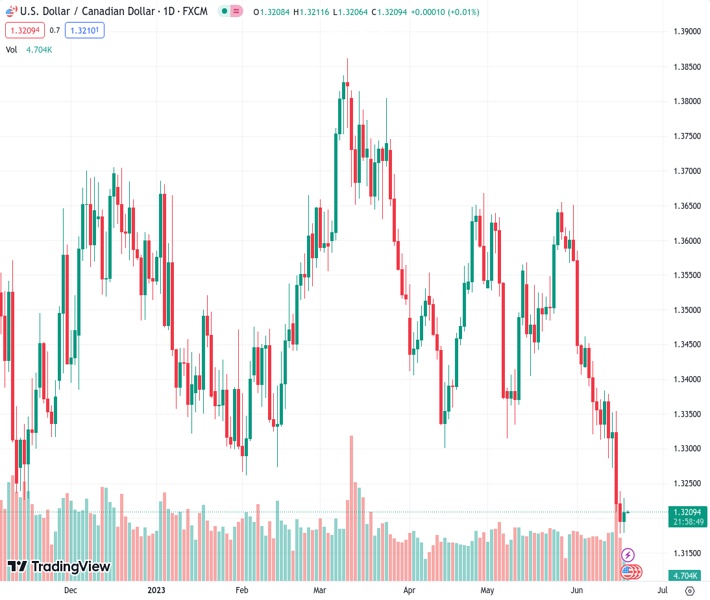
The USDCAD pair is moving downward and is currently trading at 1.3207, indicating small losses of 0.01%.
…
This is a premium post.
[s2If !current_user_can(access_s2member_level4)]Please register for FREE REGISTER to read full post below containing analysis. In case of any error or you think you are not able to read the full post below, please email us at support#nehcap.com [lwa][/s2If] [s2If current_user_can(access_s2member_level1)]
- USD/CAD continues its downward trajectory, trading at 1.3207, showing minor losses of 0.01%.
The pair currently trades last at 1.32083.
The previous day high was 1.3239 while the previous day low was 1.3178. The daily 38.2% Fib levels comes at 1.3201, expected to provide support. Similarly, the daily 61.8% fib level is at 1.3216, expected to provide resistance.
USD/CAD trimmed some of its losses last Friday on Monday, though as the Asian session begins, it is poised to extend its ongoing losses during the previous three weeks. The USD/CAD is trading at 1.3207, down 0.01%, after hitting a weekly high of 1.3229.
During the last week, the USD/CAD broke a support trendline drawn from 2022 November lows, surpassing around 1.3314. That exacerbated the USD/CAD fall to new year-to-date (YTD) lows of 1.3177 before rebounding above 1.3200.
It should be said the pair bias is downward, but if the USD/CAD trades above the May 8 daily low of 1.3314, that could pave the way for sideways action. If that outcome continues, the USD/CAD first resistance would be the 20-day Exponential Moving Average (EMA) at 1.3357, followed by the 200-day EMA at 1.3405.
Conversely, if USD/CAD drops below 1.3200, further downside is expected, with the pair challenging the YTD low, followed by the September 13 low of 1.2954.
Notably, the Relative Strength Index (RSI) portrays the pair as oversold, while the three-day Rate of Change (RoC) indicates the pair is heading downwards.
Technical Levels: Supports and Resistances
USDCAD currently trading at 1.3208 at the time of writing. Pair opened at 1.3198 and is trading with a change of 0.08 % .
| Overview | Overview.1 | |
|---|---|---|
| 0 | Today last price | 1.3208 |
| 1 | Today Daily Change | 0.0010 |
| 2 | Today Daily Change % | 0.0800 |
| 3 | Today daily open | 1.3198 |
The pair remains strongly bearish on the daily time frame. It trades below the 20 SMA @ 1.3443, 50 SMA 1.3469, 100 SMA @ 1.3512 and 200 SMA @ 1.3518.
| Trends | Trends.1 | |
|---|---|---|
| 0 | Daily SMA20 | 1.3443 |
| 1 | Daily SMA50 | 1.3469 |
| 2 | Daily SMA100 | 1.3512 |
| 3 | Daily SMA200 | 1.3518 |
The previous day high was 1.3239 while the previous day low was 1.3178. The daily 38.2% Fib levels comes at 1.3201, expected to provide support. Similarly, the daily 61.8% fib level is at 1.3216, expected to provide resistance.
Note the levels of interest below:
- Pivot support is noted at 1.3171, 1.3143, 1.3109
- Pivot resistance is noted at 1.3232, 1.3267, 1.3294
| Levels | Levels.1 |
|---|---|
| Previous Daily High | 1.3239 |
| Previous Daily Low | 1.3178 |
| Previous Weekly High | 1.3384 |
| Previous Weekly Low | 1.3178 |
| Previous Monthly High | 1.3655 |
| Previous Monthly Low | 1.3315 |
| Daily Fibonacci 38.2% | 1.3201 |
| Daily Fibonacci 61.8% | 1.3216 |
| Daily Pivot Point S1 | 1.3171 |
| Daily Pivot Point S2 | 1.3143 |
| Daily Pivot Point S3 | 1.3109 |
| Daily Pivot Point R1 | 1.3232 |
| Daily Pivot Point R2 | 1.3267 |
| Daily Pivot Point R3 | 1.3294 |
[/s2If]
Nehcap Expert Advisor
The NEHCAP MT4 EA is high quality professional trading system geared to generate returns without using GRID or martingales. Each trade has strict risk per trade parameter. The pairs under management include EURUSD, GBPUSD, AUDCAD, AUDNZD,GBPAUD, EURAUD, EURCAD, CHFJPY and many more.
The system is trading live: LIVE ACCOUNT TRACKING
You can run it free. Apply for a free trial and track our account. Buy the system or use profit share mechanism to generate returns on your MT4.
Join Our Telegram Group
")


