Throughout the Asian trading session on Monday, the exchange rate between the US dollar and the Indian rupee (USDINR), which stands at 81.9625, displayed limited fluctuations within a narrow trading range.
…
This is a premium post.
[s2If !current_user_can(access_s2member_level4)]Please register for FREE REGISTER to read full post below containing analysis. In case of any error or you think you are not able to read the full post below, please email us at support#nehcap.com [lwa][/s2If] [s2If current_user_can(access_s2member_level1)]
- USD/INR oscillates in a narrow trading band through the Asian session on Monday.
The pair currently trades last at 81.9625.
The previous day high was 82.0217 while the previous day low was 81.8477. The daily 38.2% Fib levels comes at 81.9552, expected to provide support. Similarly, the daily 61.8% fib level is at 81.9142, expected to provide support.
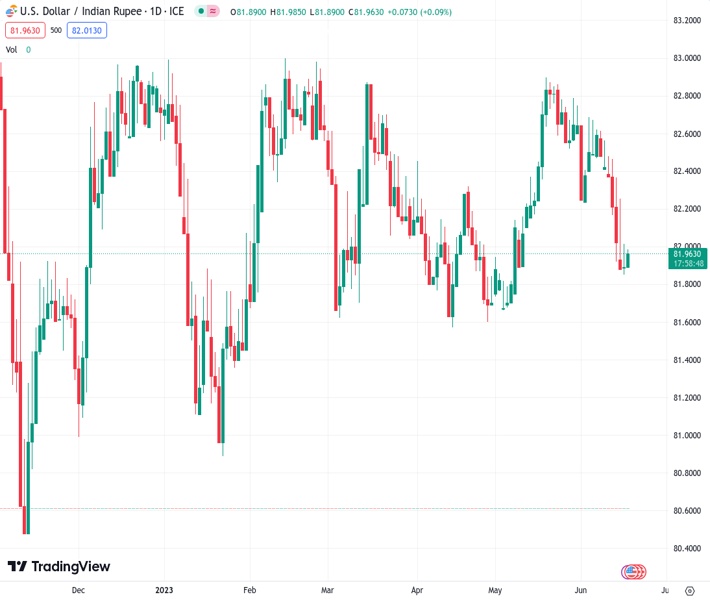
The USD/INR pair struggles to capitalize on Friday’s modest bounce from the 81.85 region, or its lowest level since May 9 and kicks off the new week on a subdued note. Spot prices oscillate in a narrow trading band through the Asian session and currently trade just below the 82.00 mark, nearly unchanged for the day.
From a technical perspective, last week’s sustained break and acceptance below the very important 200-day Simple Moving Average (SMA) was seen as a fresh trigger for bearish traders. Moreover, oscillators on the daily chart are holding deep in the negative territory and are still far from being in the oversold zone. This, in turn, reaffirms the negative outlook and suggests that the path of least resistance for the USD/INR pair is to the downside.
Hence, a subsequent slide towards testing the next relevant support, near the 81.70-81.65 region, looks like a distinct possibility. Some follow-through selling will make a fresh breakdown and pave the way for an extension of the recent retracement slide from the vicinity of the 83.00 round-figure mark witnessed over the past four weeks or so.
On the flip side, the 200-day SMA, currently pegged around the 82.10 area, now seems to act as an immediate hurdle ahead of the 82.30 horizontal zone. A sustained strength beyond, however, might negate the negative outlook and trigger some near-term short-covering move. The USD/INR pair might then climb back towards the 82.70-82.75 hurdle before making a fresh attempt to conquer the 83.00 mark.
Technical Levels: Supports and Resistances
USDINR currently trading at 81.982 at the time of writing. Pair opened at 81.943 and is trading with a change of 0.05 % .
| Overview | Overview.1 | |
|---|---|---|
| 0 | Today last price | 81.982 |
| 1 | Today Daily Change | 0.039 |
| 2 | Today Daily Change % | 0.050 |
| 3 | Today daily open | 81.943 |
The pair remains strongly bearish on the daily time frame. It trades below the 20 SMA @ 82.473, 50 SMA 82.2057, 100 SMA @ 82.2838 and 200 SMA @ 82.0505.
| Trends | Trends.1 | |
|---|---|---|
| 0 | Daily SMA20 | 82.4730 |
| 1 | Daily SMA50 | 82.2057 |
| 2 | Daily SMA100 | 82.2838 |
| 3 | Daily SMA200 | 82.0505 |
The previous day high was 82.0217 while the previous day low was 81.8477. The daily 38.2% Fib levels comes at 81.9552, expected to provide support. Similarly, the daily 61.8% fib level is at 81.9142, expected to provide support.
Note the levels of interest below:
- Pivot support is noted at 81.8533, 81.7635, 81.6793
- Pivot resistance is noted at 82.0273, 82.1115, 82.2013
| Levels | Levels.1 |
|---|---|
| Previous Daily High | 82.0217 |
| Previous Daily Low | 81.8477 |
| Previous Weekly High | 82.5680 |
| Previous Weekly Low | 81.8477 |
| Previous Monthly High | 82.9810 |
| Previous Monthly Low | 81.6435 |
| Daily Fibonacci 38.2% | 81.9552 |
| Daily Fibonacci 61.8% | 81.9142 |
| Daily Pivot Point S1 | 81.8533 |
| Daily Pivot Point S2 | 81.7635 |
| Daily Pivot Point S3 | 81.6793 |
| Daily Pivot Point R1 | 82.0273 |
| Daily Pivot Point R2 | 82.1115 |
| Daily Pivot Point R3 | 82.2013 |
[/s2If]
Nehcap Expert Advisor
The NEHCAP MT4 EA is high quality professional trading system geared to generate returns without using GRID or martingales. Each trade has strict risk per trade parameter. The pairs under management include EURUSD, GBPUSD, AUDCAD, AUDNZD,GBPAUD, EURAUD, EURCAD, CHFJPY and many more.
The system is trading live: LIVE ACCOUNT TRACKING
You can run it free. Apply for a free trial and track our account. Buy the system or use profit share mechanism to generate returns on your MT4.
Join Our Telegram Group


