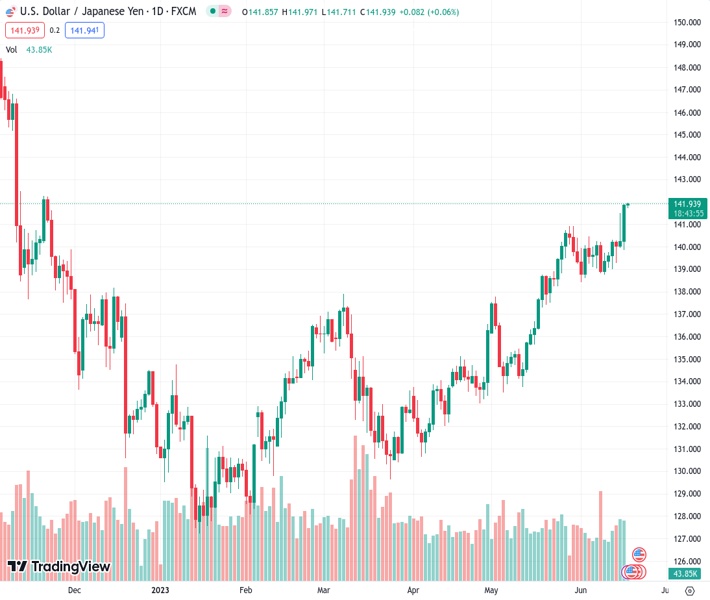
On Monday, the USDJPY reached a new yearly high at 141.938, however, there was no further buying to support the increase.
…
This is a premium post.
[s2If !current_user_can(access_s2member_level4)]Please register for FREE REGISTER to read full post below containing analysis. In case of any error or you think you are not able to read the full post below, please email us at support#nehcap.com [lwa][/s2If] [s2If current_user_can(access_s2member_level1)]
- USD/JPY touches a fresh YTD peak on Monday, albeit lacks follow-through buying.
The pair currently trades last at 141.938.
The previous day high was 141.92 while the previous day low was 139.85. The daily 38.2% Fib levels comes at 141.13, expected to provide support. Similarly, the daily 61.8% fib level is at 140.64, expected to provide support.
The USD/JPY pair enters a bullish consolidation phase on Monday and oscillates in a narrow band below the 142.00 mark, or its highest level since November 2022 touched during the Asian session.
The Japanese Yen (JPY) continues to be undermined by the Bank of Japan’s (BoJ) decision on Friday to leave its ultra-loose policy settings to support the fragile domestic economy. In fact, the Japanese central bank held its short-term interest rate target at -0.1% and made no changes to its yield curve control policy. The BoJ also kept intact its view that inflation will slow later this year, suggesting that it will remain a dovish outlier amid global uncertainty. This, in turn, is seen as a key factor acting as a tailwind for the USD/JPY pair on the first day of a new week.
The US Dollar (USD), on the other hand, edges higher for the second straight day and looks to build on Friday’s modest bounce from over a one-month low amid the Federal Reserve’s (Fed) hawkish outlook. It is worth recalling that the US central bank last week decided to pause its year-long rate-hiking cycle, though signalled that borrowing costs may still need to rise by as much as 50 bps by the end of this year. This, in turn, assists the Greenback to gain some follow-through traction and further lends support to the USD/JPY pair, though the uptick lacks bullish conviction.
The recent softer US macro data raised questions over how much headroom the Fed has to keep raising rates. Moreover, market participants seem confident that the Fed is almost done with its tightening, which is holding back the USD bulls from placing aggressive bets. Apart from this, a generally softer tone around the equity markets helps limit losses for the safe-haven JPY and further contributes to capping the upside for the USD/JPY pair, at least for now. Nevertheless, the fundamental backdrop suggests that the path of least resistance for spot prices is to the upside.
Hence, any meaningful corrective decline might still be seen as a buying opportunity and is more likely to remain cushioned. The market focus now shifts to Fed Chair Jerome Powell’s two-day congressional testimony on Wednesday and Thursday, which will be closely scrutinized for fresh clues about the future rate-hike path. This, in turn, will play a key role in influencing the USD price dynamics and provide some meaningful impetus to the USD/JPY pair. Traders this week will also confront the release of the flash US PMI prints on Friday.
Technical Levels: Supports and Resistances
USDJPY currently trading at 141.89 at the time of writing. Pair opened at 141.86 and is trading with a change of 0.02 % .
| Overview | Overview.1 | |
|---|---|---|
| 0 | Today last price | 141.89 |
| 1 | Today Daily Change | 0.03 |
| 2 | Today Daily Change % | 0.02 |
| 3 | Today daily open | 141.86 |
The pair remains strongly bullish on the daily timeframe. It trades above its 20 SMA @ 139.77, 50 SMA 136.91, 100 SMA @ 135.01 and 200 SMA @ 137.24.
| Trends | Trends.1 | |
|---|---|---|
| 0 | Daily SMA20 | 139.77 |
| 1 | Daily SMA50 | 136.91 |
| 2 | Daily SMA100 | 135.01 |
| 3 | Daily SMA200 | 137.24 |
The previous day high was 141.92 while the previous day low was 139.85. The daily 38.2% Fib levels comes at 141.13, expected to provide support. Similarly, the daily 61.8% fib level is at 140.64, expected to provide support.
Note the levels of interest below:
- Pivot support is noted at 140.51, 139.15, 138.44
- Pivot resistance is noted at 142.57, 143.27, 144.63
| Levels | Levels.1 |
|---|---|
| Previous Daily High | 141.92 |
| Previous Daily Low | 139.85 |
| Previous Weekly High | 141.92 |
| Previous Weekly Low | 139.01 |
| Previous Monthly High | 140.93 |
| Previous Monthly Low | 133.50 |
| Daily Fibonacci 38.2% | 141.13 |
| Daily Fibonacci 61.8% | 140.64 |
| Daily Pivot Point S1 | 140.51 |
| Daily Pivot Point S2 | 139.15 |
| Daily Pivot Point S3 | 138.44 |
| Daily Pivot Point R1 | 142.57 |
| Daily Pivot Point R2 | 143.27 |
| Daily Pivot Point R3 | 144.63 |
[/s2If]
Nehcap Expert Advisor
The NEHCAP MT4 EA is high quality professional trading system geared to generate returns without using GRID or martingales. Each trade has strict risk per trade parameter. The pairs under management include EURUSD, GBPUSD, AUDCAD, AUDNZD,GBPAUD, EURAUD, EURCAD, CHFJPY and many more.
The system is trading live: LIVE ACCOUNT TRACKING
You can run it free. Apply for a free trial and track our account. Buy the system or use profit share mechanism to generate returns on your MT4.
Join Our Telegram Group


