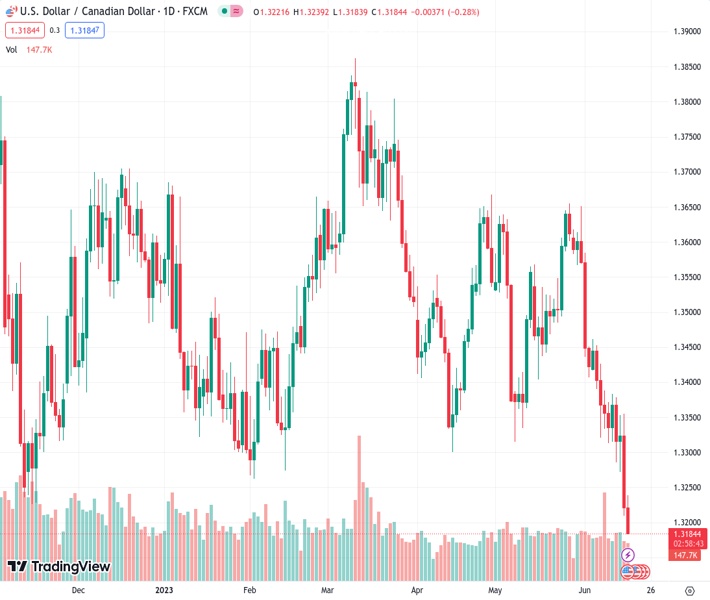
The USD/CAD hit a multi-month low of 1.3188, which was last observed in September 2022.
…
This is a premium post.
[s2If !current_user_can(access_s2member_level4)]Please register for FREE REGISTER to read full post below containing analysis. In case of any error or you think you are not able to read the full post below, please email us at support#nehcap.com [lwa][/s2If] [s2If current_user_can(access_s2member_level1)]
- The USD/CAD dipped to a multi-month low of 1.3188, last seen in September 2022.
The pair currently trades last at 1.31848.
The previous day high was 1.3355 while the previous day low was 1.321. The daily 38.2% Fib levels comes at 1.3265, expected to provide resistance. Similarly, the daily 61.8% fib level is at 1.3299, expected to provide resistance.
On Friday, the USD/CAD continued its downward momentum dropping to a low of 1.3188 and its set to confirm a 100 pips weekly decline. Expectations that the rate peak of the Federal Reserve (Fed) will weaken the US Dollar linger but an upbeat Consumer Confidence Index from the University of Michigan and hawkish Fed speakers limit the downside potential.
The University of Michigan (UoM) reported that the Michigan Consumer Sentiment Index for June surpassed expectations at 63.9, indicating increased consumer confidence compared to the previous figure of 59.2. Additionally, the five-year Consumer Inflation Expectation dropped to 3% from the anticipated 3.1%. These positive data points helped strengthen the US Dollar.
Furthermore, after the Federal Open Market Committee (FOMC) released its monetary policy statement and updated dot plots on Wednesday – indicating a projected additional tightening of 50 basis points – various speakers from the Federal Reserve reiterated on Friday their concern with inflation, showing their willingness to continue hiking.
Christopher Waller of the Federal Reserve expressed concerns about the lack of progress in core inflation and suggested the possibility of further tightening if necessary, while Thomas Barkin argued that he is comfortable “doing more” if the data warrants it. As a response, the US bond yields are seeing gains across the curve. The 10-year bond yield rose to 3.78%, while the 2-year yield stands at 4.74% and the 5-year yielding 4.00%, respectively, with all three seeing more than 1% increases on the day.
According to the daily chart, the USD/CAD holds a bearish outlook for the short term as the Relative Strength Index (RSI) and Moving Average Convergence Divergence (MACD) both suggest that the sellers have control while the pair trades well below its main moving averages. However, the RSI pierced through the oversold threshold, indicating that a healthy upwards correction may be needed in the upcoming sessions.
The 1.31500 level remains the key support level for USD/CAD. If broken, the 1.3100 zone and 1.3090 area could come into play in case of further downside. Furthermore, a move above the 1.3250 zone would favor the pair’s bullish momentum, with next resistances at the 1.3270 area and 1.3330 psychological mark.
Technical Levels: Supports and Resistances
USDCAD currently trading at 1.3186 at the time of writing. Pair opened at 1.3225 and is trading with a change of -0.29 % .
| Overview | Overview.1 | |
|---|---|---|
| 0 | Today last price | 1.3186 |
| 1 | Today Daily Change | -0.0039 |
| 2 | Today Daily Change % | -0.2900 |
| 3 | Today daily open | 1.3225 |
The pair remains strongly bearish on the daily time frame. It trades below the 20 SMA @ 1.3458, 50 SMA 1.3476, 100 SMA @ 1.3513 and 200 SMA @ 1.3518.
| Trends | Trends.1 | |
|---|---|---|
| 0 | Daily SMA20 | 1.3458 |
| 1 | Daily SMA50 | 1.3476 |
| 2 | Daily SMA100 | 1.3513 |
| 3 | Daily SMA200 | 1.3518 |
The previous day high was 1.3355 while the previous day low was 1.321. The daily 38.2% Fib levels comes at 1.3265, expected to provide resistance. Similarly, the daily 61.8% fib level is at 1.3299, expected to provide resistance.
Note the levels of interest below:
- Pivot support is noted at 1.3172, 1.3118, 1.3027
- Pivot resistance is noted at 1.3316, 1.3408, 1.3461
| Levels | Levels.1 |
|---|---|
| Previous Daily High | 1.3355 |
| Previous Daily Low | 1.3210 |
| Previous Weekly High | 1.3462 |
| Previous Weekly Low | 1.3313 |
| Previous Monthly High | 1.3655 |
| Previous Monthly Low | 1.3315 |
| Daily Fibonacci 38.2% | 1.3265 |
| Daily Fibonacci 61.8% | 1.3299 |
| Daily Pivot Point S1 | 1.3172 |
| Daily Pivot Point S2 | 1.3118 |
| Daily Pivot Point S3 | 1.3027 |
| Daily Pivot Point R1 | 1.3316 |
| Daily Pivot Point R2 | 1.3408 |
| Daily Pivot Point R3 | 1.3461 |
[/s2If]
Nehcap Expert Advisor
The NEHCAP MT4 EA is high quality professional trading system geared to generate returns without using GRID or martingales. Each trade has strict risk per trade parameter. The pairs under management include EURUSD, GBPUSD, AUDCAD, AUDNZD,GBPAUD, EURAUD, EURCAD, CHFJPY and many more.
The system is trading live: LIVE ACCOUNT TRACKING
You can run it free. Apply for a free trial and track our account. Buy the system or use profit share mechanism to generate returns on your MT4.
Join Our Telegram Group


