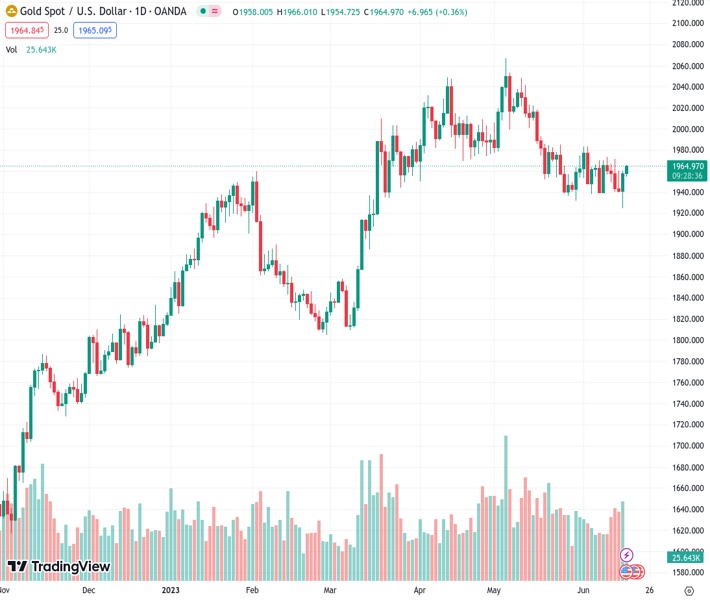
The price of gold, represented by XAUUSD at 1,965.26, has extended its upward trend beyond $1,960.00 due to a positive market sentiment.
…
This is a premium post.
[s2If !current_user_can(access_s2member_level4)]Please register for FREE REGISTER to read full post below containing analysis. In case of any error or you think you are not able to read the full post below, please email us at support#nehcap.com [lwa][/s2If] [s2If current_user_can(access_s2member_level1)]
- Gold price has stretched its rally above $1,960.00 amid a risk-on mood.
The pair currently trades last at 1965.26.
The previous day high was 1960.31 while the previous day low was 1924.85. The daily 38.2% Fib levels comes at 1946.76, expected to provide support. Similarly, the daily 61.8% fib level is at 1938.4, expected to provide support.
Gold price (XAU/USD) has stretched its rally to near $1,964.00 in the European session. The precious metal is expected to deliver more gains as the USD Index (DXY) looks vulnerable above the crucial support of 102.00.
S&P500 futures have recovered entire losses posted in Asia and has shifted into positive territory as the risk appetite theme is getting traction. The US Dollar Index (DXY) is consolidating in a narrow range above 102.00. US Treasury yields are also choppy amid a lack of potential triggers ahead.
The interest rate decision of skipping interest rate hikes by the Federal Reserve (Fed) has provided relief to the market participants. The neutral decision of Fed chair Jerome Powell was followed by a hawkish dot plot in which it is confirmed that two more interest rate hikes will be announced. However, investors are hoping that current United States economic prospects are turning vulnerable as labor market conditions are further easing now.
On Thursday, the US Department of Labor reported higher-than-expected jobless claims straight for four weeks. It seems that higher interest rates by the Fed and tight credit conditions by US regional banks have put a lid on the route of credit disbursals to firms, which has forced them to underutilize their total capacity.
Gold price has delivered a breakout of the Falling Channel chart pattern formed on a two-hour scale. A breakout of the aforementioned chart pattern supports a bullish reversal. The precious metal is approaching the horizontal resistance plotted from May 16 low at $1,985.53.
Gold price has climbed above the 200-period Exponential Moving Average (EMA) at $1,960.00, which indicates that the long-term trend has turned bullish.
The Relative Strength Index (RSI) (14) is looking to shift into the bullish range of 60.00-80.00. An occurrence of the same will activate the upside momentum.
Technical Levels: Supports and Resistances
XAUUSD currently trading at 1964.99 at the time of writing. Pair opened at 1958.12 and is trading with a change of 0.35 % .
| Overview | Overview.1 | |
|---|---|---|
| 0 | Today last price | 1964.99 |
| 1 | Today Daily Change | 6.87 |
| 2 | Today Daily Change % | 0.35 |
| 3 | Today daily open | 1958.12 |
The pair is trading above its 20 Daily moving average @ 1957.79, below its 50 Daily moving average @ 1986.32 , above its 100 Daily moving average @ 1941.79 and above its 200 Daily moving average @ 1846.39
| Trends | Trends.1 | |
|---|---|---|
| 0 | Daily SMA20 | 1957.79 |
| 1 | Daily SMA50 | 1986.32 |
| 2 | Daily SMA100 | 1941.79 |
| 3 | Daily SMA200 | 1846.39 |
The previous day high was 1960.31 while the previous day low was 1924.85. The daily 38.2% Fib levels comes at 1946.76, expected to provide support. Similarly, the daily 61.8% fib level is at 1938.4, expected to provide support.
Note the levels of interest below:
- Pivot support is noted at 1935.21, 1912.3, 1899.75
- Pivot resistance is noted at 1970.67, 1983.22, 2006.13
| Levels | Levels.1 |
|---|---|
| Previous Daily High | 1960.31 |
| Previous Daily Low | 1924.85 |
| Previous Weekly High | 1973.15 |
| Previous Weekly Low | 1938.15 |
| Previous Monthly High | 2079.76 |
| Previous Monthly Low | 1932.12 |
| Daily Fibonacci 38.2% | 1946.76 |
| Daily Fibonacci 61.8% | 1938.40 |
| Daily Pivot Point S1 | 1935.21 |
| Daily Pivot Point S2 | 1912.30 |
| Daily Pivot Point S3 | 1899.75 |
| Daily Pivot Point R1 | 1970.67 |
| Daily Pivot Point R2 | 1983.22 |
| Daily Pivot Point R3 | 2006.13 |
[/s2If]
Nehcap Expert Advisor
The NEHCAP MT4 EA is high quality professional trading system geared to generate returns without using GRID or martingales. Each trade has strict risk per trade parameter. The pairs under management include EURUSD, GBPUSD, AUDCAD, AUDNZD,GBPAUD, EURAUD, EURCAD, CHFJPY and many more.
The system is trading live: LIVE ACCOUNT TRACKING
You can run it free. Apply for a free trial and track our account. Buy the system or use profit share mechanism to generate returns on your MT4.
Join Our Telegram Group


