The USDJPY exchange rate surges to the most elevated levels it has seen since November 2022, exhibiting the most substantial incremental increase in a month. However, the limited possible increase is anticipated, according to the analysis of @nehcap.
…
This is a premium post.
[s2If !current_user_can(access_s2member_level4)]Please register for FREE REGISTER to read full post below containing analysis. In case of any error or you think you are not able to read the full post below, please email us at support#nehcap.com [lwa][/s2If] [s2If current_user_can(access_s2member_level1)]
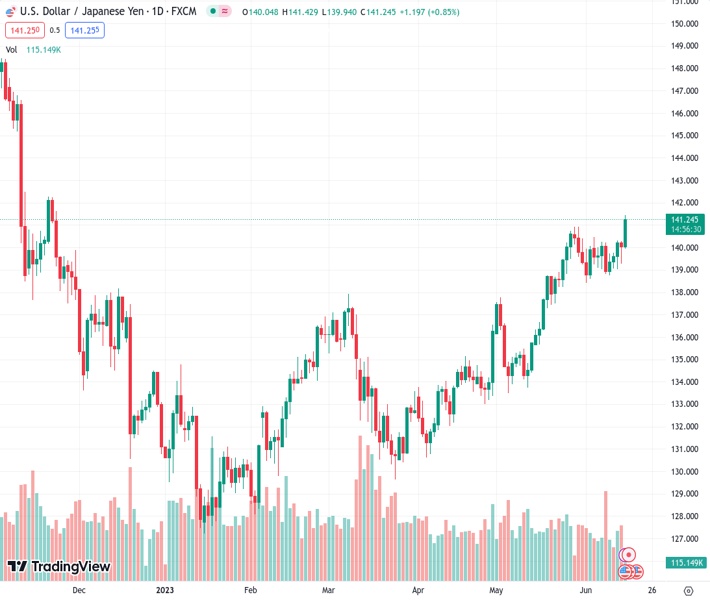
- USD/JPY jumps to the highest levels since November 2022, prints the biggest daily gains in a month.
The pair currently trades last at 141.242.
The previous day high was 140.28 while the previous day low was 139.28. The daily 38.2% Fib levels comes at 139.67, expected to provide support. Similarly, the daily 61.8% fib level is at 139.9, expected to provide support.
USD/JPY bulls are high as the Yen pair renews the yearly peak near 141.45 amid early Thursday. In doing so, the risk-barometer pair prints the biggest daily gains, so far, in a month amid upbeat US Treasury bond yields.
That said, the US 10-year Treasury bond yields rise three basis points (bps) to 3.83% by the press time, versus the previous day’s lackluster move near a three-week top. While tracing the firmer bond coupons, the hawkish Fed bias and economic fears gain major attention.
Also read: USD/JPY looks to build on momentum beyond 141.00, highest since November 2022
On the other hand, sustained trading beyond the previous high of 2023, of around 141.00, enables the USD/JPY buyers to keep the reins, especially amid an impending bull cross on the MACD.
However, the nearly overbought RSI (14) line joins a three-month-old rising trend line, near 141.60 at the latest, to cap the pair’s immediate upside.
It should be noted that the late November 2022 high of near 142.25 and the 61.8% Fibonacci retracement level of the pair’s October 2022 to January 2023 fall, near 142.45, act as additional upside filters for the USD/JPY bulls to cross for conviction.
On the flip side, a one-month-old rising support line joins the 50% Fibonacci retracement level to limit the short-term downside of the USD/JPY pair near 139.55. Following that, the 200-DMA support of near 137.25 will be in the spotlight.
That said, the 141.00 mark and the 140.00 psychological magnet are extra supports to watch for the Yen pair traders.
Trend: Limited upside expected
Technical Levels: Supports and Resistances
USDJPY currently trading at 141.34 at the time of writing. Pair opened at 140.06 and is trading with a change of 0.91% % .
| Overview | Overview.1 | |
|---|---|---|
| 0 | Today last price | 141.34 |
| 1 | Today Daily Change | 1.28 |
| 2 | Today Daily Change % | 0.91% |
| 3 | Today daily open | 140.06 |
The pair remains strongly bullish on the daily timeframe. It trades above its 20 SMA @ 139.49, 50 SMA 136.54, 100 SMA @ 134.79 and 200 SMA @ 137.26.
| Trends | Trends.1 | |
|---|---|---|
| 0 | Daily SMA20 | 139.49 |
| 1 | Daily SMA50 | 136.54 |
| 2 | Daily SMA100 | 134.79 |
| 3 | Daily SMA200 | 137.26 |
The previous day high was 140.28 while the previous day low was 139.28. The daily 38.2% Fib levels comes at 139.67, expected to provide support. Similarly, the daily 61.8% fib level is at 139.9, expected to provide support.
Note the levels of interest below:
- Pivot support is noted at 139.46, 138.87, 138.46
- Pivot resistance is noted at 140.47, 140.88, 141.47
| Levels | Levels.1 |
|---|---|
| Previous Daily High | 140.28 |
| Previous Daily Low | 139.28 |
| Previous Weekly High | 140.45 |
| Previous Weekly Low | 138.76 |
| Previous Monthly High | 140.93 |
| Previous Monthly Low | 133.50 |
| Daily Fibonacci 38.2% | 139.67 |
| Daily Fibonacci 61.8% | 139.90 |
| Daily Pivot Point S1 | 139.46 |
| Daily Pivot Point S2 | 138.87 |
| Daily Pivot Point S3 | 138.46 |
| Daily Pivot Point R1 | 140.47 |
| Daily Pivot Point R2 | 140.88 |
| Daily Pivot Point R3 | 141.47 |
[/s2If]
Nehcap Expert Advisor
The NEHCAP MT4 EA is high quality professional trading system geared to generate returns without using GRID or martingales. Each trade has strict risk per trade parameter. The pairs under management include EURUSD, GBPUSD, AUDCAD, AUDNZD,GBPAUD, EURAUD, EURCAD, CHFJPY and many more.
The system is trading live: LIVE ACCOUNT TRACKING
You can run it free. Apply for a free trial and track our account. Buy the system or use profit share mechanism to generate returns on your MT4.
Join Our Telegram Group
")


