The USDIDR currency pair is seeing an increase in buying interest, causing it to reach a new intraday high and the highest levels in eight days.
…
This is a premium post.
[s2If !current_user_can(access_s2member_level4)]Please register for FREE REGISTER to read full post below containing analysis. In case of any error or you think you are not able to read the full post below, please email us at support#nehcap.com [lwa][/s2If] [s2If current_user_can(access_s2member_level1)]
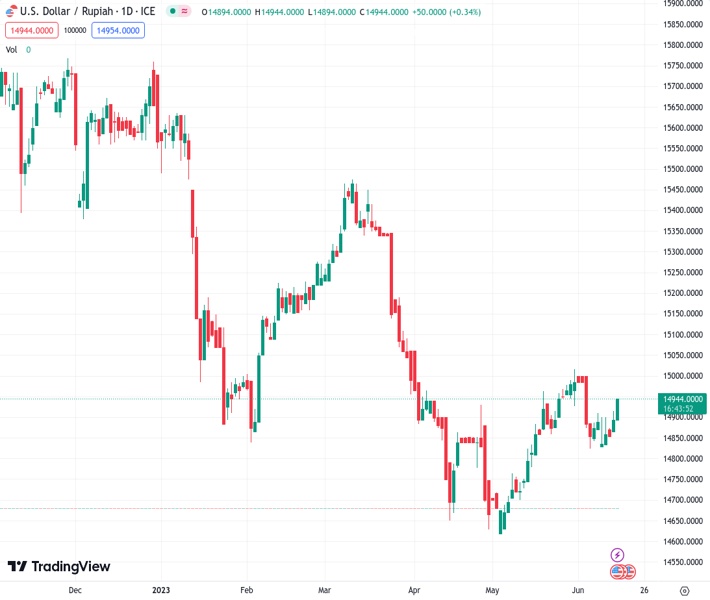
- USD/IDR picks up bids to renew intraday high, rises to the highest levels in eight days.
The pair currently trades last at 14955.0.
The previous day high was 14932.25 while the previous day low was 14844.0. The daily 38.2% Fib levels comes at 14898.5385, expected to provide support. Similarly, the daily 61.8% fib level is at 14877.7115, expected to provide support.
USD/IDR stays on the front foot for the second consecutive day as it refreshed the weekly top near 14,955 after witnessing mixed Indonesia trade numbers early Thursday. Also exerting downside pressure on the Indonesia Rupiah (IDR) is the US Dollar’s rebound amid hopes of a July Fed rate hike.
Indonesia’s headline Trade Balance drops to $0.44B in May versus $3.02B market forecasts and $3.94B previous readings. The details, however, appear impressive as Imports rose to 14.35%, from -22.32% previous fall and -11.0% prior, whereas the Exports improved to 0.96% versus the previous contraction of 29.4%. It should be noted that the cautious optimism in Asia, amid downbeat China data and hawkish Fed concerns, also propel the USD/IDR prices.
On the other hand, the US Federal Open Market Committee (FOMC) kept the benchmark interest rate unchanged at 5.0-5.25%, matching market expectations of pausing the multi-month-old hawkish cycle after 10 consecutive rate lifts. However, the upbeat FOMC Economic Projections and Federal Reserve (Fed) Chairman Jerome Powell’s speech renewed the hawkish Fed bias and propel the USD/IDR price.
Amid these plays, S&P500 Futures struggle at the yearly top whereas the US Treasury bond yields rebound after witnessing a pullback during the post-Fed move. That said, the US Dollar Index (DXY) prints the first daily gain in three while bouncing off the monthly low to around 103.30 at the latest.
Moving on, US Retail Sales for May and other mid-tier activity data, as well as the weekly Jobless Claims, will be important for the USD/IDR pair traders as the Fed has already highlighted the importance of each incoming data for decision-making.
A convergence of the two-month-old descending trend line and the 100-DMA, around 15,025 at the latest, challenge USD/IDR bulls even if oscillators are favoring a gradual recovery.
Technical Levels: Supports and Resistances
USDIDR currently trading at 14952 at the time of writing. Pair opened at 14906.25 and is trading with a change of 0.31% % .
| Overview | Overview.1 | |
|---|---|---|
| 0 | Today last price | 14952 |
| 1 | Today Daily Change | 45.7500 |
| 2 | Today Daily Change % | 0.31% |
| 3 | Today daily open | 14906.25 |
The pair is trading above its 20 Daily moving average @ 14914.91, above its 50 Daily moving average @ 14856.586 , below its 100 Daily moving average @ 15022.187 and below its 200 Daily moving average @ 15222.784
| Trends | Trends.1 | |
|---|---|---|
| 0 | Daily SMA20 | 14914.910 |
| 1 | Daily SMA50 | 14856.586 |
| 2 | Daily SMA100 | 15022.187 |
| 3 | Daily SMA200 | 15222.784 |
The previous day high was 14932.25 while the previous day low was 14844.0. The daily 38.2% Fib levels comes at 14898.5385, expected to provide support. Similarly, the daily 61.8% fib level is at 14877.7115, expected to provide support.
Note the levels of interest below:
- Pivot support is noted at 14856.0833, 14805.9167, 14767.8333
- Pivot resistance is noted at 14944.3333, 14982.4167, 15032.5833
| Levels | Levels.1 |
|---|---|
| Previous Daily High | 14932.2500 |
| Previous Daily Low | 14844.0000 |
| Previous Weekly High | 15003.0000 |
| Previous Weekly Low | 14140.0500 |
| Previous Monthly High | 15029.0500 |
| Previous Monthly Low | 14571.8000 |
| Daily Fibonacci 38.2% | 14898.5385 |
| Daily Fibonacci 61.8% | 14877.7115 |
| Daily Pivot Point S1 | 14856.0833 |
| Daily Pivot Point S2 | 14805.9167 |
| Daily Pivot Point S3 | 14767.8333 |
| Daily Pivot Point R1 | 14944.3333 |
| Daily Pivot Point R2 | 14982.4167 |
| Daily Pivot Point R3 | 15032.5833 |
[/s2If]
Nehcap Expert Advisor
The NEHCAP MT4 EA is high quality professional trading system geared to generate returns without using GRID or martingales. Each trade has strict risk per trade parameter. The pairs under management include EURUSD, GBPUSD, AUDCAD, AUDNZD,GBPAUD, EURAUD, EURCAD, CHFJPY and many more.
The system is trading live: LIVE ACCOUNT TRACKING
You can run it free. Apply for a free trial and track our account. Buy the system or use profit share mechanism to generate returns on your MT4.
Join Our Telegram Group
")


