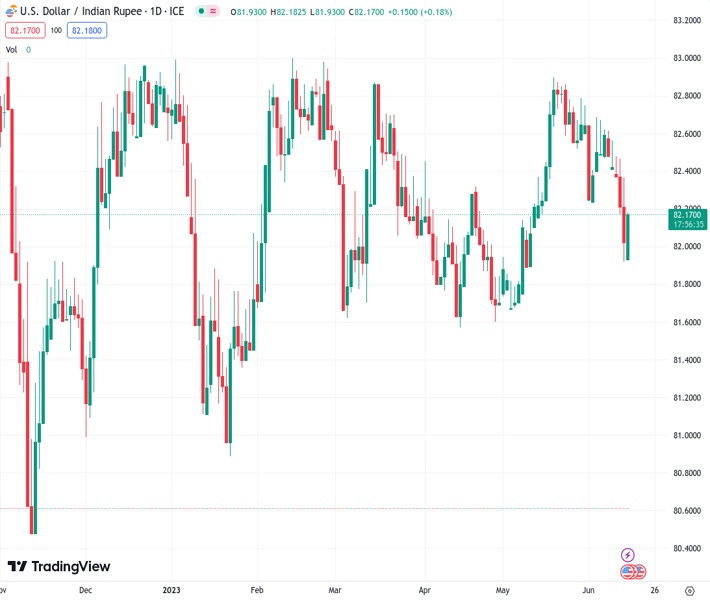
The USDINR at 82.1610 is holding onto slight gains after bouncing back from a low not seen in a month and bringing an end to a five-day streak of losses. The opinion of Nehcap is that a small recovery is anticipated.
…
This is a premium post.
[s2If !current_user_can(access_s2member_level4)]Please register for FREE REGISTER to read full post below containing analysis. In case of any error or you think you are not able to read the full post below, please email us at support#nehcap.com [lwa][/s2If] [s2If current_user_can(access_s2member_level1)]
- USD/INR clings to mild gains after bouncing off one-month low, snaps five-day losing streak.
The pair currently trades last at 82.1610.
The previous day high was 82.3905 while the previous day low was 81.897. The daily 38.2% Fib levels comes at 82.0855, expected to provide support. Similarly, the daily 61.8% fib level is at 82.202, expected to provide resistance.
USD/INR picks up bids to print minor intraday gains around 82.15 during the first positive day in six amid early Thursday in Europe. In doing so, the Indian Rupee (INR) pair bounces off the lowest level in five weeks as the US Dollar portrays the market’s consolidation of the latest losses around the multi-day low.
That said, the US Dollar Index (DXY) rebounds from the lowest level in a month to snap a two-day downtrend near 103.30 by the press time.
The greenback’s gauge versus the six major currencies dropped to a fresh multi-day low after the US Federal Reserve (Fed) kept the benchmark Fed rate unchanged at 5.0-5.25%, matching market expectations of pausing the multi-month-old hawkish cycle that propelled rates for 10 consecutive times.
It’s worth noting, however, that the US Dollar’s latest gains could be linked to the increasing odds of witnessing a Fed rate hike in July. On the same line, the Fed’s dot plot rose 30 bps from March for 2024 and 2025 to 4.6% and 3.4% respectively while the median rate forecasts suggest two more rate increases in 2023. Further, no rate cuts nor recession is expected in the current year whereas the median estimation for the US Gross Domestic Product (GDP) rose to 1.0% from 0.4% in March. Additionally, Powell’s speech unveils a “meeting by meeting” approach for decision-making but signals July as a ‘live’ meeting, suggesting a 0.25% rate hike.
On the other hand, downbeat prints of China Retail Sales and Industrial Production weighed on the market sentiment in the Asia-Pacific zone.
Moving on, US Retail Sales for May and other mid-tier activity data, as well as the weekly Jobless Claims, will be important for the USD/INR pair traders as the Fed has already highlighted the importance of each incoming data for decision-making.
A clear bounce off the 200-DMA support of 82.00 joins the below 50.0 levels of the RSI (14) line to underpin hopes of USD/INR bottom-picking, suggesting a further recovery towards the 100-DMA resistance of near 82.30.
It’s worth noting, however, that the USD/INR bulls need to cross a three-week-old resistance line, close to 82.50 by the press time, to retake control.
Meanwhile, a downside break of the 200-DMA should conquer an upward-sloping support line from November 2022, near 81.90 at the latest, to convince the USD/INR bears in challenging the April month’s bottom of around 81.50.
Trend: Limited recovery expected
Technical Levels: Supports and Resistances
USDINR currently trading at 82.1624 at the time of writing. Pair opened at 82.0514 and is trading with a change of 0.14% % .
| Overview | Overview.1 | |
|---|---|---|
| 0 | Today last price | 82.1624 |
| 1 | Today Daily Change | 0.1110 |
| 2 | Today Daily Change % | 0.14% |
| 3 | Today daily open | 82.0514 |
The pair is trading below its 20 Daily moving average @ 82.5585, below its 50 Daily moving average @ 82.2026 , below its 100 Daily moving average @ 82.2754 and above its 200 Daily moving average @ 82.0282
| Trends | Trends.1 | |
|---|---|---|
| 0 | Daily SMA20 | 82.5585 |
| 1 | Daily SMA50 | 82.2026 |
| 2 | Daily SMA100 | 82.2754 |
| 3 | Daily SMA200 | 82.0282 |
The previous day high was 82.3905 while the previous day low was 81.897. The daily 38.2% Fib levels comes at 82.0855, expected to provide support. Similarly, the daily 61.8% fib level is at 82.202, expected to provide resistance.
Note the levels of interest below:
- Pivot support is noted at 81.8355, 81.6195, 81.342
- Pivot resistance is noted at 82.3289, 82.6064, 82.8224
| Levels | Levels.1 |
|---|---|
| Previous Daily High | 82.3905 |
| Previous Daily Low | 81.8970 |
| Previous Weekly High | 82.7120 |
| Previous Weekly Low | 82.4030 |
| Previous Monthly High | 82.9810 |
| Previous Monthly Low | 81.6435 |
| Daily Fibonacci 38.2% | 82.0855 |
| Daily Fibonacci 61.8% | 82.2020 |
| Daily Pivot Point S1 | 81.8355 |
| Daily Pivot Point S2 | 81.6195 |
| Daily Pivot Point S3 | 81.3420 |
| Daily Pivot Point R1 | 82.3289 |
| Daily Pivot Point R2 | 82.6064 |
| Daily Pivot Point R3 | 82.8224 |
[/s2If]
Nehcap Expert Advisor
The NEHCAP MT4 EA is high quality professional trading system geared to generate returns without using GRID or martingales. Each trade has strict risk per trade parameter. The pairs under management include EURUSD, GBPUSD, AUDCAD, AUDNZD,GBPAUD, EURAUD, EURCAD, CHFJPY and many more.
The system is trading live: LIVE ACCOUNT TRACKING
You can run it free. Apply for a free trial and track our account. Buy the system or use profit share mechanism to generate returns on your MT4.
Join Our Telegram Group
")


