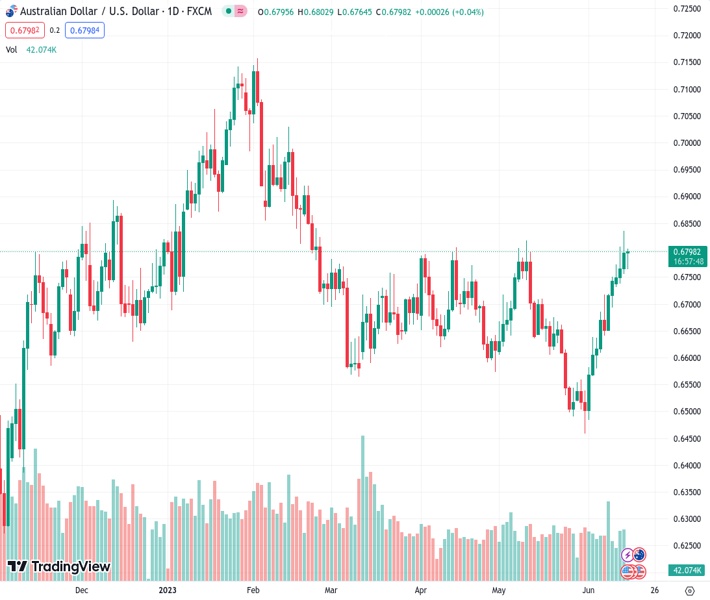
The AUDUSD pair, currently at 0.67993, has fallen from its late February peak and touched an upward support line that is eight days old. The view of @nehcap is that the potential for loss is restricted.
…
This is a premium post.
[s2If !current_user_can(access_s2member_level4)]Please register for FREE REGISTER to read full post below containing analysis. In case of any error or you think you are not able to read the full post below, please email us at support#nehcap.com [lwa][/s2If] [s2If current_user_can(access_s2member_level1)]
- AUD/USD retreats from the highest level since late February, pokes eight-day-old ascending support line.
The pair currently trades last at 0.67993.
The previous day high was 0.6836 while the previous day low was 0.6756. The daily 38.2% Fib levels comes at 0.6805, expected to provide resistance. Similarly, the daily 61.8% fib level is at 0.6786, expected to provide support.
AUD/USD fades a five-day-old bullish momentum at the highest levels in nearly 16 weeks as markets await more clues to confirm the Fed’s hawkish bias for the July rate hike.
In doing so, the Aussie pair struggles to cheer upbeat employment and inflation data from home, as well as downbeat China statistics during early Thursday. That said, the Aussie pair remains indecisive near 0.6795 as it prods a short-term support line at the latest.
Also read: AUD/USD bounces off daily low on upbeat Australian jobs report, up next Chinese macro data
Technically, an upward-sloping trend line from June 05, near 0.6785 at the latest, restricts immediate AUD/USD downside even as the overbought RSI (14) line signals the pair’s pullback moves.
However, a clear downside break of the stated support line will make the AUD/USD pair vulnerable to declining towards the mid-May swing high of around 0.6710 ahead of targeting the 200-SMA level surrounding 0.6655.
On the other hand, AUD/USD recovery should witness downbeat US data and easing odds of the Fed’s July rate hike to again aim for the key resistance line stretched from mid-April, close to 0.6835.
Following that, a run-up towards the December 2022 peak of around 0.6895 and then to the 0.6900 round figure can’t be ruled out.
Trend: Limited downside expected
Technical Levels: Supports and Resistances
AUDUSD currently trading at 0.679 at the time of writing. Pair opened at 0.6796 and is trading with a change of -0.09% % .
| Overview | Overview.1 | |
|---|---|---|
| 0 | Today last price | 0.679 |
| 1 | Today Daily Change | -0.0006 |
| 2 | Today Daily Change % | -0.09% |
| 3 | Today daily open | 0.6796 |
The pair remains strongly bullish on the daily timeframe. It trades above its 20 SMA @ 0.6627, 50 SMA 0.6664, 100 SMA @ 0.6732 and 200 SMA @ 0.6691.
| Trends | Trends.1 | |
|---|---|---|
| 0 | Daily SMA20 | 0.6627 |
| 1 | Daily SMA50 | 0.6664 |
| 2 | Daily SMA100 | 0.6732 |
| 3 | Daily SMA200 | 0.6691 |
The previous day high was 0.6836 while the previous day low was 0.6756. The daily 38.2% Fib levels comes at 0.6805, expected to provide resistance. Similarly, the daily 61.8% fib level is at 0.6786, expected to provide support.
Note the levels of interest below:
- Pivot support is noted at 0.6756, 0.6716, 0.6676
- Pivot resistance is noted at 0.6836, 0.6875, 0.6915
| Levels | Levels.1 |
|---|---|
| Previous Daily High | 0.6836 |
| Previous Daily Low | 0.6756 |
| Previous Weekly High | 0.6751 |
| Previous Weekly Low | 0.6579 |
| Previous Monthly High | 0.6818 |
| Previous Monthly Low | 0.6458 |
| Daily Fibonacci 38.2% | 0.6805 |
| Daily Fibonacci 61.8% | 0.6786 |
| Daily Pivot Point S1 | 0.6756 |
| Daily Pivot Point S2 | 0.6716 |
| Daily Pivot Point S3 | 0.6676 |
| Daily Pivot Point R1 | 0.6836 |
| Daily Pivot Point R2 | 0.6875 |
| Daily Pivot Point R3 | 0.6915 |
[/s2If]
Nehcap Expert Advisor
The NEHCAP MT4 EA is high quality professional trading system geared to generate returns without using GRID or martingales. Each trade has strict risk per trade parameter. The pairs under management include EURUSD, GBPUSD, AUDCAD, AUDNZD,GBPAUD, EURAUD, EURCAD, CHFJPY and many more.
The system is trading live: LIVE ACCOUNT TRACKING
You can run it free. Apply for a free trial and track our account. Buy the system or use profit share mechanism to generate returns on your MT4.
Join Our Telegram Group
")


