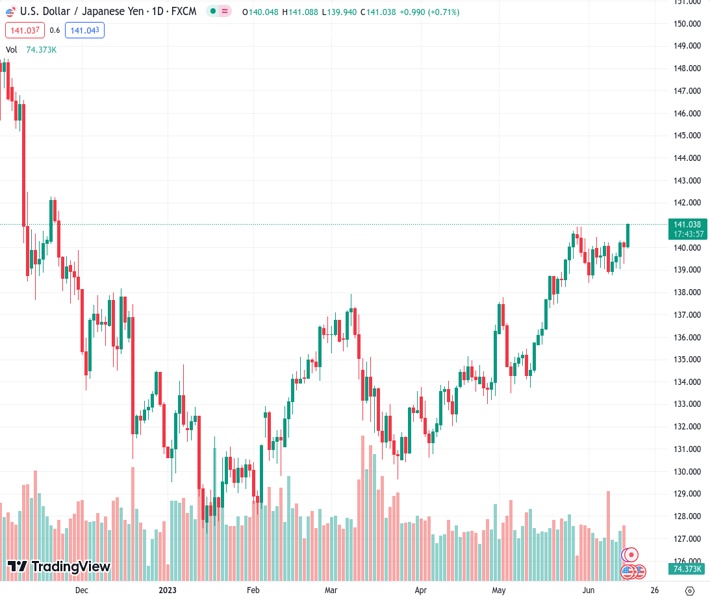
On Thursday, the currency pair USDJPY exhibited robust upward momentum, reaching a new high for the year, indicating a bullish trend.
…
This is a premium post.
[s2If !current_user_can(access_s2member_level4)]Please register for FREE REGISTER to read full post below containing analysis. In case of any error or you think you are not able to read the full post below, please email us at support#nehcap.com [lwa][/s2If] [s2If current_user_can(access_s2member_level1)]
- USD/JPY regains strong positive traction on Thursday and rallies to a fresh YTD top.
The pair currently trades last at 141.037.
The previous day high was 140.28 while the previous day low was 139.28. The daily 38.2% Fib levels comes at 139.67, expected to provide support. Similarly, the daily 61.8% fib level is at 139.9, expected to provide support.
The USD/JPY pair catches aggressive bids during the Asian session on Thursday and touches the 141.00 mark for the first time since November 2022, confirming a breakout through a two-week-old trading range.
The Japanese Yen (JPY) weakens in reaction to the weaker domestic data, showing that imports tumbled 9.9% in May and the trade deficit widened more than anticipated, to ¥1,372.5 billion in May. This validates expectations that the Bank of Japan (BoJ) will stick to its ultra-easy policy stance to support the economy and ensure that the recent positive signs are sustained. Apart from this, the emergence of some US Dollar (USD) buying provides an additional boost to the USD/JPY pair and remains supportive of the strong intraday move up.
The USD Index (DXY), which tracks the Greenback against a basket of currencies, is seen building on the overnight late rebound from a one-month low in the wake of the Federal Reserve’s hawkish commentary. It is worth recalling that the US central bank, as anticipated, held interest rates steady at the end of a two-day policy meeting on Wednesday, but signalled that borrowing costs will increase by another 50 bps by end-December. This marks a big divergence in comparison to the BoJ’s dovish outlook and acts as a tailwind for the USD/JPY pair.
The intraday rally, meanwhile, could further be attributed to some technical buying above the 140.25-140.30 hurdle, representing the top end of the recent trading band held over the past two weeks or so. The subsequent move-up could be seen as a fresh trigger for bulls and might have already set the stage for further gains. That said, traders might refrain from placing fresh bets and prefer to move to the sidelines ahead of the BoJ policy meeting on Friday. In the meantime, investors might take cues from the US macro data for some impetus.
Thursday’s US economic docket features the release of monthly Retail Sales, the usual Weekly Initial Jobless Claims, the Empire State Manufacturing Index, the Philly Fed Manufacturing Index and Industrial Production figures. The data might influence the USD price dynamics and produce short-term trading opportunities around the USD/JPY pair, heading into the central bank event risk.
Technical Levels: Supports and Resistances
USDJPY currently trading at 141.02 at the time of writing. Pair opened at 140.06 and is trading with a change of 0.69 % .
| Overview | Overview.1 | |
|---|---|---|
| 0 | Today last price | 141.02 |
| 1 | Today Daily Change | 0.96 |
| 2 | Today Daily Change % | 0.69 |
| 3 | Today daily open | 140.06 |
The pair remains strongly bullish on the daily timeframe. It trades above its 20 SMA @ 139.49, 50 SMA 136.54, 100 SMA @ 134.79 and 200 SMA @ 137.26.
| Trends | Trends.1 | |
|---|---|---|
| 0 | Daily SMA20 | 139.49 |
| 1 | Daily SMA50 | 136.54 |
| 2 | Daily SMA100 | 134.79 |
| 3 | Daily SMA200 | 137.26 |
The previous day high was 140.28 while the previous day low was 139.28. The daily 38.2% Fib levels comes at 139.67, expected to provide support. Similarly, the daily 61.8% fib level is at 139.9, expected to provide support.
Note the levels of interest below:
- Pivot support is noted at 139.46, 138.87, 138.46
- Pivot resistance is noted at 140.47, 140.88, 141.47
| Levels | Levels.1 |
|---|---|
| Previous Daily High | 140.28 |
| Previous Daily Low | 139.28 |
| Previous Weekly High | 140.45 |
| Previous Weekly Low | 138.76 |
| Previous Monthly High | 140.93 |
| Previous Monthly Low | 133.50 |
| Daily Fibonacci 38.2% | 139.67 |
| Daily Fibonacci 61.8% | 139.90 |
| Daily Pivot Point S1 | 139.46 |
| Daily Pivot Point S2 | 138.87 |
| Daily Pivot Point S3 | 138.46 |
| Daily Pivot Point R1 | 140.47 |
| Daily Pivot Point R2 | 140.88 |
| Daily Pivot Point R3 | 141.47 |
[/s2If]
Nehcap Expert Advisor
The NEHCAP MT4 EA is high quality professional trading system geared to generate returns without using GRID or martingales. Each trade has strict risk per trade parameter. The pairs under management include EURUSD, GBPUSD, AUDCAD, AUDNZD,GBPAUD, EURAUD, EURCAD, CHFJPY and many more.
The system is trading live: LIVE ACCOUNT TRACKING
You can run it free. Apply for a free trial and track our account. Buy the system or use profit share mechanism to generate returns on your MT4.
Join Our Telegram Group
")


