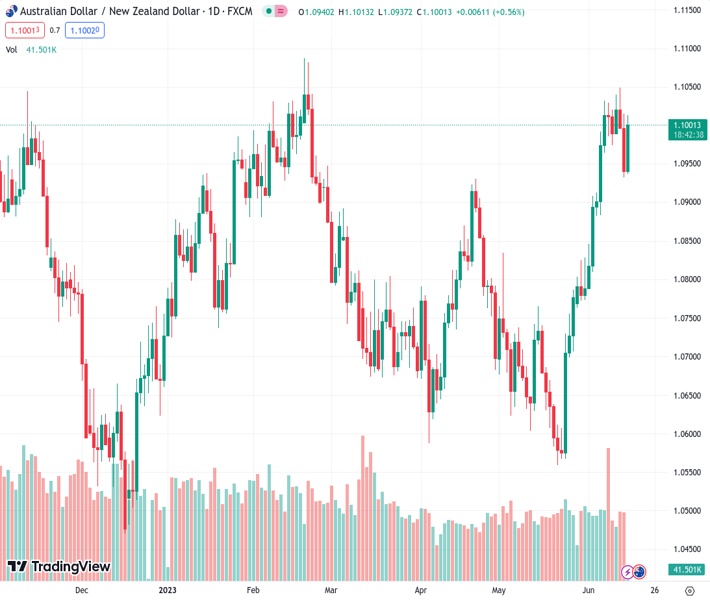
The currency pair AUDNZD has risen by 50 pips to reach 1.10023, overcoming significant obstacles due to favorable economic data from Australia and New Zealand. According to the observation of @nehcap, there is a possibility of the currency pair going even higher in the future.
…
This is a premium post.
[s2If !current_user_can(access_s2member_level4)]Please register for FREE REGISTER to read full post below containing analysis. In case of any error or you think you are not able to read the full post below, please email us at support#nehcap.com [lwa][/s2If] [s2If current_user_can(access_s2member_level1)]
- AUD/NZD jumps 50 pips, clears key upside hurdles on strong Australia, New Zealand data.
- Australia Employment Change rallies, Consumer Inflation Expectations improve while NZ Q1 GDP signals ‘technical’ recession.
- Clear upside break of immediate resistance line, key HMAs favor bulls to aim for 61.8% FE level.
- Bears need to break 1.0880 support to qualify for a small fight.
The pair currently trades last at 1.10023.
The previous day high was 1.1015 while the previous day low was 1.0932. The daily 38.2% Fib levels comes at 1.0964, expected to provide support. Similarly, the daily 61.8% fib level is at 1.0984, expected to provide support.
AUD/NZD marks a steep reversal from the weekly low, as well as snaps a two-day downtrend, as it jumps to 1.1010 after witnessing upbeat Australia employment data on early Thursday. That said, the exotic pair previously cheered strong Australian inflation clues amid fears of a technical recession in New Zealand.
That said, Australia’s Consumer Inflation Expectations for June rose to 5.2% versus 4.8% expected and 5.0% prior. Further, the Employment Change rallied by 75.9K in May compared to 15K market forecasts and -4.3K previous readings. Additionally, Australia’s Unemployment Rate drops to 3.6% against expectations of witnessing a no change figures of 3.7%.
On the other hand, New Zealand’s first quarter (Q1) 2023 Gross Domestic Product (GDP) matches the -0.1% QoQ forecast, versus -0.7% (revised) prior. Further details reveal that the yearly figures ease to 2.2% YoY for the said period versus 2.6% market expectations and 2.3% previous readings. Given the second consecutive negative quarterly growth figure, the Pacific nation flags a ‘technical’ recession.
Technically, the AUD/NZD pair crosses a downward-sloping trend line and the 200-Hour Moving Average (HMA) after the data, which in turn allows the bulls to poke the 100-HMA hurdle of around 1.1010 by the press time.
It should be noted that the upbeat MACD signals and RSI (14), not overbought, adds strength to the bullish bias suggesting the AUD/NZD pair’s run-up towards refreshing the monthly high, near 1.1050 by the press time. In doing so, it will aim for the 61.8% Fibonacci Expansion (FE) of its May 30 to June 13 moves, near 1.1100.
Alternatively, the resistance-turned-support of near 1.0990 precedes the 200-HMA level of around 1.0985 to restrict the short-term downside of the pair.
Following that, the latest swing low and June 06 bottom, respectively near 1.0930 and 1.0880 will act as the final defenses of the AUD/NZD bulls.
Trend: Further upside expected
Technical Levels: Supports and Resistances
AUDNZD currently trading at 1.1009 at the time of writing. Pair opened at 1.0949 and is trading with a change of 0.55% % .
| Overview | Overview.1 | |
|---|---|---|
| 0 | Today last price | 1.1009 |
| 1 | Today Daily Change | 0.0060 |
| 2 | Today Daily Change % | 0.55% |
| 3 | Today daily open | 1.0949 |
The pair remains strongly bullish on the daily timeframe. It trades above its 20 SMA @ 1.083, 50 SMA 1.078, 100 SMA @ 1.0815 and 200 SMA @ 1.0883.
| Trends | Trends.1 | |
|---|---|---|
| 0 | Daily SMA20 | 1.0830 |
| 1 | Daily SMA50 | 1.0780 |
| 2 | Daily SMA100 | 1.0815 |
| 3 | Daily SMA200 | 1.0883 |
The previous day high was 1.1015 while the previous day low was 1.0932. The daily 38.2% Fib levels comes at 1.0964, expected to provide support. Similarly, the daily 61.8% fib level is at 1.0984, expected to provide support.
Note the levels of interest below:
- Pivot support is noted at 1.0916, 1.0882, 1.0832
- Pivot resistance is noted at 1.0999, 1.1049, 1.1082
| Levels | Levels.1 |
|---|---|
| Previous Daily High | 1.1015 |
| Previous Daily Low | 1.0932 |
| Previous Weekly High | 1.1032 |
| Previous Weekly Low | 1.0884 |
| Previous Monthly High | 1.0834 |
| Previous Monthly Low | 1.0560 |
| Daily Fibonacci 38.2% | 1.0964 |
| Daily Fibonacci 61.8% | 1.0984 |
| Daily Pivot Point S1 | 1.0916 |
| Daily Pivot Point S2 | 1.0882 |
| Daily Pivot Point S3 | 1.0832 |
| Daily Pivot Point R1 | 1.0999 |
| Daily Pivot Point R2 | 1.1049 |
| Daily Pivot Point R3 | 1.1082 |
[/s2If]
Nehcap Expert Advisor
The NEHCAP MT4 EA is high quality professional trading system geared to generate returns without using GRID or martingales. Each trade has strict risk per trade parameter. The pairs under management include EURUSD, GBPUSD, AUDCAD, AUDNZD,GBPAUD, EURAUD, EURCAD, CHFJPY and many more.
The system is trading live: LIVE ACCOUNT TRACKING
You can run it free. Apply for a free trial and track our account. Buy the system or use profit share mechanism to generate returns on your MT4.
Join Our Telegram Group
")


