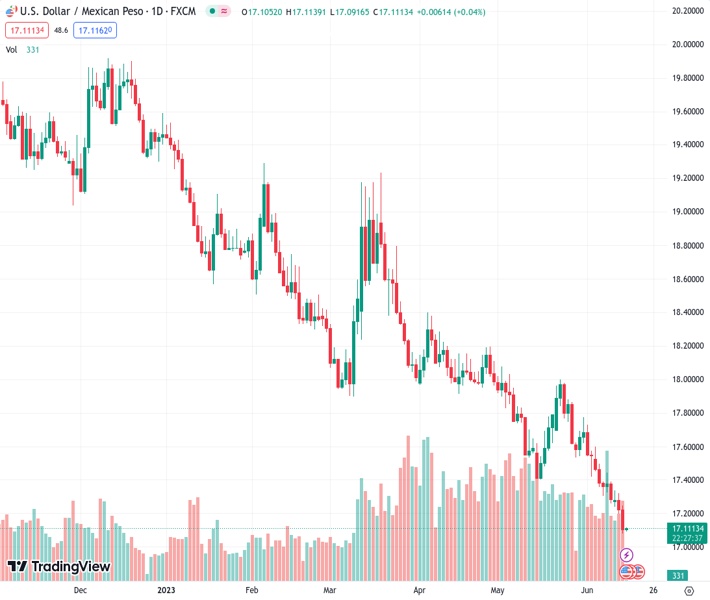
The USDMXN pair dropped to a level not seen in nearly seven years following the announcement of the Fed’s interest rate decision.
…
This is a premium post.
[s2If !current_user_can(access_s2member_level4)]Please register for FREE REGISTER to read full post below containing analysis. In case of any error or you think you are not able to read the full post below, please email us at support#nehcap.com [lwa][/s2If] [s2If current_user_can(access_s2member_level1)]
- USD/MXN plunges to a near seven-year low after Fed’s rate decision.
The pair currently trades last at 17.1102.
The previous day high was 17.3211 while the previous day low was 17.1972. The daily 38.2% Fib levels comes at 17.2445, expected to provide resistance. Similarly, the daily 61.8% fib level is at 17.2738, expected to provide resistance.
USD/MXN fell to new year-to-date (YTD) lows of 17.0900 after the US Federal Reserve (Fed) decided to hold rates at the 5.00%-5.25% range after ten consecutive meetings of interest rate increases. Initially weakened the Mexican Peso (MXN), but Powell’s stance tilted “slightly dovish,” triggering a leg-down on the USD/MXN. The USD/MXN is trading at 17.0990, nearby new seven-year lows.
Fed Day came on Wednesday, and Fed Chair Jerome Powell and company delivered its first pause as a sign, according to him, of “moderation” on its tightening cycle. In their monetary policy statement, Fed officials highlighted the labor market remains robust, the unemployment rate low, and inflation elevated. Nevertheless, tightness on credit conditions and the cumulative tightening weighed on Powell and Co. to keep rates unchanged.
Aside from the statement, the Summary of Economic Projections (SEP) surprised the markets, with 12 policymakers expecting at least 50 bps of additional tightening to the Federal Funds Rate (FFR), moving the needle up to 5.6%, according to the median.
Delving deeper into the SEP, growth is expected to be higher than March’s 0.4%, at 1%, while the Unemployment Rate was downward revised to 4.1%. The Fed’s preferred gauge for inflation, the core PCE is predicted to hit 3.9% by year’s end, up from 3.6% in March.
Back to Jerome Powell’s press conference, he said the Fed is watching credit conditions and keeping the door open for July’s monetary policy meeting. He said the Fed would decide its policy meeting by meeting, suggesting everything is on the table for July.
After the Fed and Jerome Powell’s conference, the US Dollar Index (DXY) settled for a close above 103.000, though it did not weigh on the USD/MXN pair, which extended its losses below 17.10. US Treasury bond yields finished unchanged, with the 10-year benchmark note rate at 3.79%, three bps below its high of the day.
Following the Fed’s decision, the USD/MXN remains set to test the 17.00 psychological level, but firstly, USD/MXN sellers would need to challenge the 2016 low of 17.0509. Oscillators led by the Relative Strength Index (RSI) indicate the pair is oversold, while the three-day Rate of Change (RoC) depicts sellers losing momentum.
Nevertheless, a bearish continuation would put into play the 17.0000 figure. Once broken, the next support would be 16.5000 before tumbling toward an October 2015 low of 16.3267. Contrarily, if USD/MXN buyers want to shift the trend to neutral, they must conquer May 16 low-turned resistance at 17.4038.
Technical Levels: Supports and Resistances
USDMXN currently trading at 17.1159 at the time of writing. Pair opened at 17.224 and is trading with a change of -0.63 % .
| Overview | Overview.1 | |
|---|---|---|
| 0 | Today last price | 17.1159 |
| 1 | Today Daily Change | -0.1081 |
| 2 | Today Daily Change % | -0.6300 |
| 3 | Today daily open | 17.2240 |
The pair remains strongly bearish on the daily time frame. It trades below the 20 SMA @ 17.5848, 50 SMA 17.7987, 100 SMA @ 18.1505 and 200 SMA @ 18.8895.
| Trends | Trends.1 | |
|---|---|---|
| 0 | Daily SMA20 | 17.5848 |
| 1 | Daily SMA50 | 17.7987 |
| 2 | Daily SMA100 | 18.1505 |
| 3 | Daily SMA200 | 18.8895 |
The previous day high was 17.3211 while the previous day low was 17.1972. The daily 38.2% Fib levels comes at 17.2445, expected to provide resistance. Similarly, the daily 61.8% fib level is at 17.2738, expected to provide resistance.
Note the levels of interest below:
- Pivot support is noted at 17.1738, 17.1235, 17.0499
- Pivot resistance is noted at 17.2977, 17.3714, 17.4216
| Levels | Levels.1 |
|---|---|
| Previous Daily High | 17.3211 |
| Previous Daily Low | 17.1972 |
| Previous Weekly High | 17.5981 |
| Previous Weekly Low | 17.2591 |
| Previous Monthly High | 18.0780 |
| Previous Monthly Low | 17.4203 |
| Daily Fibonacci 38.2% | 17.2445 |
| Daily Fibonacci 61.8% | 17.2738 |
| Daily Pivot Point S1 | 17.1738 |
| Daily Pivot Point S2 | 17.1235 |
| Daily Pivot Point S3 | 17.0499 |
| Daily Pivot Point R1 | 17.2977 |
| Daily Pivot Point R2 | 17.3714 |
| Daily Pivot Point R3 | 17.4216 |
[/s2If]
Nehcap Expert Advisor
The NEHCAP MT4 EA is high quality professional trading system geared to generate returns without using GRID or martingales. Each trade has strict risk per trade parameter. The pairs under management include EURUSD, GBPUSD, AUDCAD, AUDNZD,GBPAUD, EURAUD, EURCAD, CHFJPY and many more.
The system is trading live: LIVE ACCOUNT TRACKING
You can run it free. Apply for a free trial and track our account. Buy the system or use profit share mechanism to generate returns on your MT4.
Join Our Telegram Group
")


