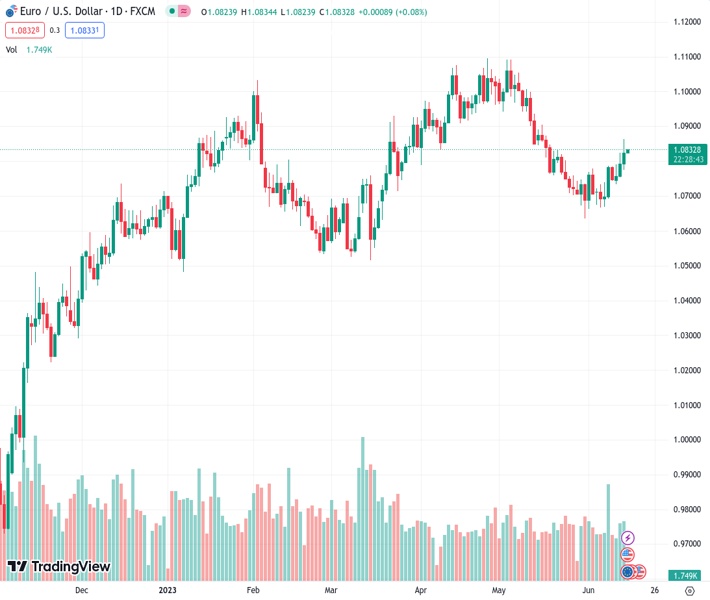
The EURUSD currency pair is increasing slowly and steadily to reach a one-month peak, pushing up a three-day trend on the day of the European Central Bank’s meeting.
…
This is a premium post.
[s2If !current_user_can(access_s2member_level4)]Please register for FREE REGISTER to read full post below containing analysis. In case of any error or you think you are not able to read the full post below, please email us at support#nehcap.com [lwa][/s2If] [s2If current_user_can(access_s2member_level1)]
- EUR/USD grinds higher at one-month top, prods three-day uptrend on ECB day.
The pair currently trades last at 1.08345.
The previous day high was 1.0824 while the previous day low was 1.0755. The daily 38.2% Fib levels comes at 1.0797, expected to provide support. Similarly, the daily 61.8% fib level is at 1.0781, expected to provide support.
EUR/USD bulls are on a joyride as they take a breather at the highest levels in a month after rising for three consecutive days before retreating from 1.0864, to 1.0830 amid early hours of the European Central Bank (ECB) monetary policy meeting day, i.e. Wednesday. It’s worth noting that the US Federal Reserve (Fed) matches market forecasts of pausing the rate hike trajectory but appeared hawkish and weighed on the Euro pair. However, the hawkish hopes from the bloc’s central bank keep the buyers hopeful ahead of the key event.
On Wednesday, the Federal Open Market Committee (FOMC) decided to keep the benchmark Fed rate unchanged in the rate of 5.0-5.25%, matching market expectations of pausing the 1.5-year-old rate hike that propelled rates for 10 consecutive times. Even so, the hawkish signals from the FOMC Economic Projections and Fed Chair Powell’s speech underpin renew bullish bias about the US central bank.
That said, dot-plot rose 30 bps from March for 2024 and 2025 to 4.6% and 3.4% respectively while the median rate forecasts suggest two more rate increases in 2023. Further, no rate cuts nor recession is expected in the current year whereas the median estimation for the US Gross Domestic Product (GDP) rose to 1.0% from 0.4% in March. Additional, Powell’s speech unveils “meeting by meeting” approach for decision-making but signals July as ‘live’ meeting, suggesting a 0.25% rate hike.
Elsewhere, Germany’s Wholesale Price Index dropped 1.1% in May, versus -1.0% expected and -0.4% prior whereas Eurozone Industrial Production rose 1.0% for April versus 0.8% expected and -3.8% prior (revised). On the other hand, the US Producer Price Index (PPI) for May dropped to 1.1% YoY versus 1.5% expected and 2.6% prior.
Amid these plays, markets remained volatile and Wall Street closed mixed whereas the US 10-year Treasury bond yield ease 1.0 basis point (bps) to 3.79% but its two-year counterpart grind higher at the three-month top to 4.70%.
Moving on, second-tier data from the bloc may entertain the EUR/USD pair traders, together with the pre-ECB speculations amid hopes of witnessing a 0.25% rate hike. That said, the Euro bulls need hawkish comments from President Christine Lagarde, as well as upbeat economic projections, to keep the reins.
Also read: ECB preview: Looking beyond next week
A daily closing beyond the 100-DMA hurdle of around 1.0800, now immediate support, keeps EUR/USD buyers hopeful. Even so, a three-month-old horizontal resistance near 1.0850-55 guards immediate upside of the Euro pair.
Technical Levels: Supports and Resistances
EURUSD currently trading at 1.0832 at the time of writing. Pair opened at 1.0793 and is trading with a change of 0.36 % .
| Overview | Overview.1 | |
|---|---|---|
| 0 | Today last price | 1.0832 |
| 1 | Today Daily Change | 0.0039 |
| 2 | Today Daily Change % | 0.3600 |
| 3 | Today daily open | 1.0793 |
The pair is trading above its 20 Daily moving average @ 1.0749, below its 50 Daily moving average @ 1.0879 , above its 100 Daily moving average @ 1.0806 and above its 200 Daily moving average @ 1.0529
| Trends | Trends.1 | |
|---|---|---|
| 0 | Daily SMA20 | 1.0749 |
| 1 | Daily SMA50 | 1.0879 |
| 2 | Daily SMA100 | 1.0806 |
| 3 | Daily SMA200 | 1.0529 |
The previous day high was 1.0824 while the previous day low was 1.0755. The daily 38.2% Fib levels comes at 1.0797, expected to provide support. Similarly, the daily 61.8% fib level is at 1.0781, expected to provide support.
Note the levels of interest below:
- Pivot support is noted at 1.0757, 1.0722, 1.0689
- Pivot resistance is noted at 1.0826, 1.0859, 1.0895
| Levels | Levels.1 |
|---|---|
| Previous Daily High | 1.0824 |
| Previous Daily Low | 1.0755 |
| Previous Weekly High | 1.0787 |
| Previous Weekly Low | 1.0667 |
| Previous Monthly High | 1.1092 |
| Previous Monthly Low | 1.0635 |
| Daily Fibonacci 38.2% | 1.0797 |
| Daily Fibonacci 61.8% | 1.0781 |
| Daily Pivot Point S1 | 1.0757 |
| Daily Pivot Point S2 | 1.0722 |
| Daily Pivot Point S3 | 1.0689 |
| Daily Pivot Point R1 | 1.0826 |
| Daily Pivot Point R2 | 1.0859 |
| Daily Pivot Point R3 | 1.0895 |
[/s2If]
Nehcap Expert Advisor
The NEHCAP MT4 EA is high quality professional trading system geared to generate returns without using GRID or martingales. Each trade has strict risk per trade parameter. The pairs under management include EURUSD, GBPUSD, AUDCAD, AUDNZD,GBPAUD, EURAUD, EURCAD, CHFJPY and many more.
The system is trading live: LIVE ACCOUNT TRACKING
You can run it free. Apply for a free trial and track our account. Buy the system or use profit share mechanism to generate returns on your MT4.
Join Our Telegram Group
")


