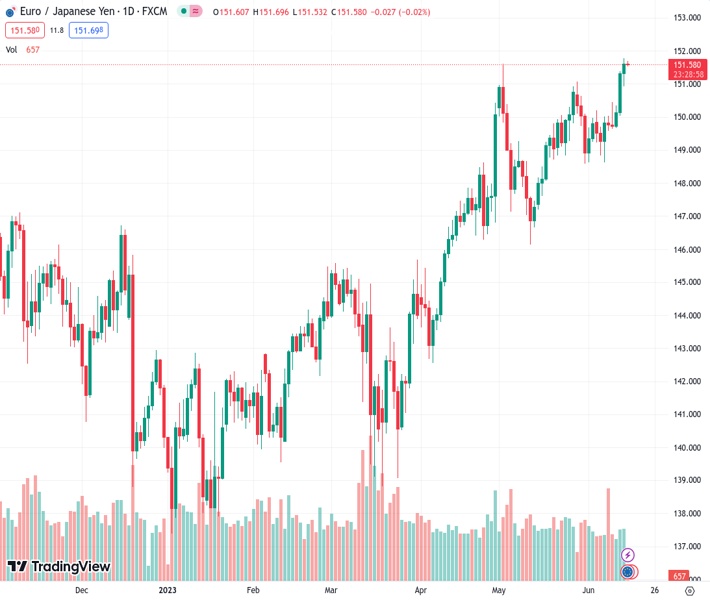
The EURJPY currency pair surged to a level above 151.75, marking a multi-year peak not seen since 2008.
…
This is a premium post.
[s2If !current_user_can(access_s2member_level4)]Please register for FREE REGISTER to read full post below containing analysis. In case of any error or you think you are not able to read the full post below, please email us at support#nehcap.com [lwa][/s2If] [s2If current_user_can(access_s2member_level1)]
- EUR/JPY rocketed to a multi-year high above 151.75, for the first time since 2008.
The pair currently trades last at 151.565.
The previous day high was 151.38 while the previous day low was 150.04. The daily 38.2% Fib levels comes at 150.86, expected to provide support. Similarly, the daily 61.8% fib level is at 150.55, expected to provide support.
On Wednesday, the EUR/JPY jumped to its highest level since October 2008 following the decision by the Federal Reserve to skip a rate hike. Ahead of Thursday’s European Central Bank (ECB) decision, where 25 basis points (bps) is priced in, German bond yields are rising, giving further traction to the Euro.
The Federal Reserve announced on Wednesday that it will hold its rates steady, to enable the members of the Federal Open Market Committee (FOMC) to evaluate further information regarding its impact on monetary policy. In addition, the terminal rate was revised upwards to 5.6%, suggesting that more rate hikes are on the horizon.
As a reaction, the 10-year US bond yield spiked to a daily high of 3.85% following the statement and stabilised around the 3.80% area following Chair Powell’s presser.
For Thursday’s ECB decision, a 25 bps hike is fully priced in and looking forward, the market has already priced in a 25 basis points hike either in July or September. Meanwhile, economic weakness and decelerating inflation in the Eurozone, seem to be giving the doves the upperhand so investors will keep an eye on the economic outlook of the bank and Madame Lagarde’s comments.
That being said, the German yields saw gains across the curve on Wednesday. The 10-year bond yield rose to 2.46%, while the 2-year yield stood at 3.09% and the 5-year yielded 2.54%.
According to the daily chart, the EUR/JPY holds a bullish outlook for the short term as the Relative Strength Index (RSI) and Moving Average Convergence Divergence (MACD) both suggest that the buyers are in control while the pair trades above its main moving averages. However, the pair leaps forward into overbought conditions with the RSI near the 70 threshold, suggesting that a downward technical correction could come into play.
Upcoming resistance for EUR/JPY is seen at the zone of around 152.00, followed by the area at 152.50 and the psychological mark at 153.00. On the other hand, in case the EUR/JPY loses more ground, support levels line up at 150.80 and below around the 20-day Simple Moving Average (SMA) at 149.90 and the 149.00 area.
Technical Levels: Supports and Resistances
EURJPY currently trading at 151.68 at the time of writing. Pair opened at 151.34 and is trading with a change of 0.22 % .
| Overview | Overview.1 | |
|---|---|---|
| 0 | Today last price | 151.68 |
| 1 | Today Daily Change | 0.34 |
| 2 | Today Daily Change % | 0.22 |
| 3 | Today daily open | 151.34 |
The pair remains strongly bullish on the daily timeframe. It trades above its 20 SMA @ 149.8, 50 SMA 148.32, 100 SMA @ 145.53 and 200 SMA @ 144.35.
| Trends | Trends.1 | |
|---|---|---|
| 0 | Daily SMA20 | 149.80 |
| 1 | Daily SMA50 | 148.32 |
| 2 | Daily SMA100 | 145.53 |
| 3 | Daily SMA200 | 144.35 |
The previous day high was 151.38 while the previous day low was 150.04. The daily 38.2% Fib levels comes at 150.86, expected to provide support. Similarly, the daily 61.8% fib level is at 150.55, expected to provide support.
Note the levels of interest below:
- Pivot support is noted at 150.46, 149.57, 149.11
- Pivot resistance is noted at 151.8, 152.26, 153.14
| Levels | Levels.1 |
|---|---|
| Previous Daily High | 151.38 |
| Previous Daily Low | 150.04 |
| Previous Weekly High | 150.44 |
| Previous Weekly Low | 148.63 |
| Previous Monthly High | 151.62 |
| Previous Monthly Low | 146.14 |
| Daily Fibonacci 38.2% | 150.86 |
| Daily Fibonacci 61.8% | 150.55 |
| Daily Pivot Point S1 | 150.46 |
| Daily Pivot Point S2 | 149.57 |
| Daily Pivot Point S3 | 149.11 |
| Daily Pivot Point R1 | 151.80 |
| Daily Pivot Point R2 | 152.26 |
| Daily Pivot Point R3 | 153.14 |
[/s2If]
Nehcap Expert Advisor
The NEHCAP MT4 EA is high quality professional trading system geared to generate returns without using GRID or martingales. Each trade has strict risk per trade parameter. The pairs under management include EURUSD, GBPUSD, AUDCAD, AUDNZD,GBPAUD, EURAUD, EURCAD, CHFJPY and many more.
The system is trading live: LIVE ACCOUNT TRACKING
You can run it free. Apply for a free trial and track our account. Buy the system or use profit share mechanism to generate returns on your MT4.
Join Our Telegram Group
")


