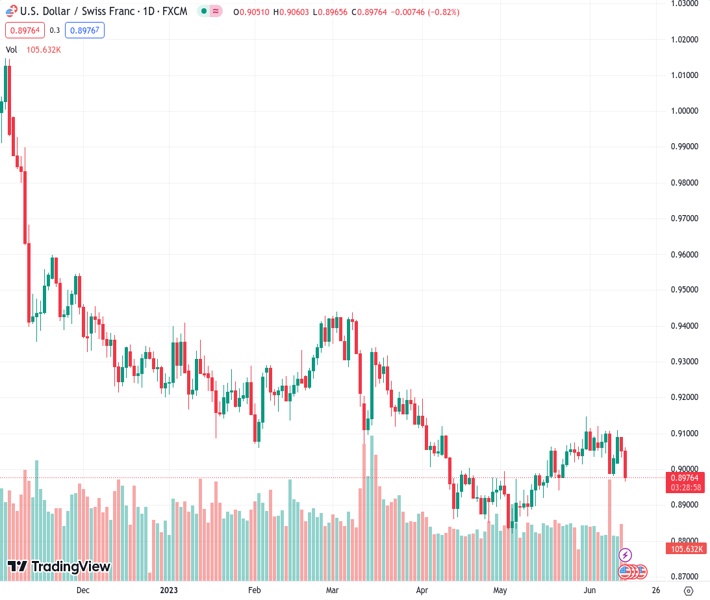
The USD/CHF pair at a rate of 0.89760 has fallen beneath important technical support levels, namely the 50 and 20-day exponential moving averages.
…
This is a premium post.
[s2If !current_user_can(access_s2member_level4)]Please register for FREE REGISTER to read full post below containing analysis. In case of any error or you think you are not able to read the full post below, please email us at support#nehcap.com [lwa][/s2If] [s2If current_user_can(access_s2member_level1)]
- USD/CHF slides below key technical support levels: 50 and 20-day EMAs.
The pair currently trades last at 0.89760.
The previous day high was 0.909 while the previous day low was 0.9032. The daily 38.2% Fib levels comes at 0.9054, expected to provide resistance. Similarly, the daily 61.8% fib level is at 0.9068, expected to provide resistance.
USD/CHF nosedives ahead of the Federal Reserve’s (Fed) decision after falling below technical support levels, trading below the 0.9000 handle after reaching a daily high of 0.9060. At the time of writing, the USD/CHF is trading at 0.8969, down 0.90%.
The USD/CHF resumed its downward biased once it slid below the 50 and 20-day Exponential Moving Averages (EMAs), each at 0.9038 and 0.9033. After that, the USD/CHF extended its losses, surpassing the 0.9000 figure and falling to fresh three-week lows of 0.8965 before aiming for 0.8970. For a bearish continuation, the USD/CHF needs to clear the May 22 swing low of 0.8940, which would expose the 0.8900 psychological price level as the next support.
Conversely, USD/CHF buyers must reclaim the 0.9000 figure if they would like to see prices higher. That would open the door toward 0.9033/38, the confluence of the 20 and 50-day EMA, ahead of testing the intersection of the 100-day EMA and April 10 daily high at 0.9114/20.
Therefore, the USD/CHF trend remains downwards, supported by oscillators. The Relative Strength Index (RSI) and the three-day Rate of Change (RoC) remained in bearish territory.
Technical Levels: Supports and Resistances
USDCHF currently trading at 0.897 at the time of writing. Pair opened at 0.9052 and is trading with a change of -0.91 % .
| Overview | Overview.1 | |
|---|---|---|
| 0 | Today last price | 0.8970 |
| 1 | Today Daily Change | -0.0082 |
| 2 | Today Daily Change % | -0.9100 |
| 3 | Today daily open | 0.9052 |
The pair remains strongly bearish on the daily time frame. It trades below the 20 SMA @ 0.9047, 50 SMA 0.8989, 100 SMA @ 0.9117 and 200 SMA @ 0.935.
| Trends | Trends.1 | |
|---|---|---|
| 0 | Daily SMA20 | 0.9047 |
| 1 | Daily SMA50 | 0.8989 |
| 2 | Daily SMA100 | 0.9117 |
| 3 | Daily SMA200 | 0.9350 |
The previous day high was 0.909 while the previous day low was 0.9032. The daily 38.2% Fib levels comes at 0.9054, expected to provide resistance. Similarly, the daily 61.8% fib level is at 0.9068, expected to provide resistance.
Note the levels of interest below:
- Pivot support is noted at 0.9026, 0.9, 0.8968
- Pivot resistance is noted at 0.9084, 0.9116, 0.9143
| Levels | Levels.1 |
|---|---|
| Previous Daily High | 0.9090 |
| Previous Daily Low | 0.9032 |
| Previous Weekly High | 0.9120 |
| Previous Weekly Low | 0.8984 |
| Previous Monthly High | 0.9148 |
| Previous Monthly Low | 0.8820 |
| Daily Fibonacci 38.2% | 0.9054 |
| Daily Fibonacci 61.8% | 0.9068 |
| Daily Pivot Point S1 | 0.9026 |
| Daily Pivot Point S2 | 0.9000 |
| Daily Pivot Point S3 | 0.8968 |
| Daily Pivot Point R1 | 0.9084 |
| Daily Pivot Point R2 | 0.9116 |
| Daily Pivot Point R3 | 0.9143 |
[/s2If]
Nehcap Expert Advisor
The NEHCAP MT4 EA is high quality professional trading system geared to generate returns without using GRID or martingales. Each trade has strict risk per trade parameter. The pairs under management include EURUSD, GBPUSD, AUDCAD, AUDNZD,GBPAUD, EURAUD, EURCAD, CHFJPY and many more.
The system is trading live: LIVE ACCOUNT TRACKING
You can run it free. Apply for a free trial and track our account. Buy the system or use profit share mechanism to generate returns on your MT4.
Join Our Telegram Group
")


