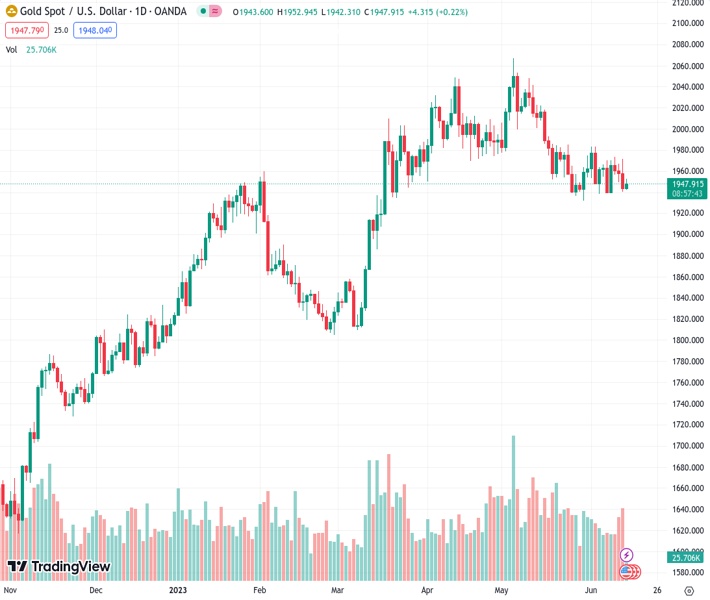
At a value of 1,947.08, gold has encountered an obstacle near the $1,952.00 mark due to the attention being directed towards the policies of the Federal Reserve.
…
This is a premium post.
[s2If !current_user_can(access_s2member_level4)]Please register for FREE REGISTER to read full post below containing analysis. In case of any error or you think you are not able to read the full post below, please email us at support#nehcap.com [lwa][/s2If] [s2If current_user_can(access_s2member_level1)]
- Gold price has sensed resistance around $1,952.00 as the focus shifts to Fed policy.
The pair currently trades last at 1947.08.
The previous day high was 1971.01 while the previous day low was 1940.05. The daily 38.2% Fib levels comes at 1951.88, expected to provide resistance. Similarly, the daily 61.8% fib level is at 1959.18, expected to provide resistance.
Gold price (XAU/USD) has sensed some selling pressure after advancing to near $1,952.00 in the European session. The precious metal has faced delicate resistance as the US Dollar Index (DXY) has displayed a short-term pause after a vertical sell-off. The downside bias for the USD index has not faded yet as a temporary pause in the policy-tightening spell by the Federal Reserve (Fed) is likely.
S&P500 futures are holding gains added in early Europe in hopes that a neutral interest rate policy announcement by Fed chair Jerome Powell would infuse optimism among the market participants. Investors should be prepared for any worse situation as an unexpected interest rate hike would dampen the market sentiment.
As per the CME Fedwatch tool, more than 95% chances are in favor of a steady interest rate policy. The risk profile could get dampened if the dot plot by the Fed turns out to be extremely hawkish. No doubt, United States inflation has softened and tight labor market conditions have released some heat. Headline inflation is still double the targeted rate of 2% and the US economy is still operating at full employment levels.
Apart from the Fed policy, investors will also focus on the US Producer Price Index (PPI) data. Monthly headline PPI is expected to show a deflation of 0.1% as gasoline prices have dropped significantly. While monthly core PPI that excludes oil and food prices is expected to maintain a 0.2% pace.
Gold price is auctioning in a Descending Triangle chart pattern on a two-hour scale, which indicates a sheer contraction in volatility. The downward-sloping trendline of the aforementioned chart pattern is plotted from June 02 high at $1,983.50 while the horizontal support is placed from June 25 low at $1,939.32.
The 200-period Exponential Moving Average (EMA) at $1,962.34 is consistently barricading Gold bulls from any recovery.
An oscillation in the 40.00-60.00 range by the Relative Strength Index (RSI) (14) indicates that investors are awaiting the Fed policy for further action.
Technical Levels: Supports and Resistances
XAUUSD currently trading at 1946.17 at the time of writing. Pair opened at 1943.76 and is trading with a change of 0.12 % .
| Overview | Overview.1 | |
|---|---|---|
| 0 | Today last price | 1946.17 |
| 1 | Today Daily Change | 2.41 |
| 2 | Today Daily Change % | 0.12 |
| 3 | Today daily open | 1943.76 |
The pair is trading below its 20 Daily moving average @ 1959.74, below its 50 Daily moving average @ 1989.14 , above its 100 Daily moving average @ 1941.63 and above its 200 Daily moving average @ 1843.98
| Trends | Trends.1 | |
|---|---|---|
| 0 | Daily SMA20 | 1959.74 |
| 1 | Daily SMA50 | 1989.14 |
| 2 | Daily SMA100 | 1941.63 |
| 3 | Daily SMA200 | 1843.98 |
The previous day high was 1971.01 while the previous day low was 1940.05. The daily 38.2% Fib levels comes at 1951.88, expected to provide resistance. Similarly, the daily 61.8% fib level is at 1959.18, expected to provide resistance.
Note the levels of interest below:
- Pivot support is noted at 1932.2, 1920.65, 1901.24
- Pivot resistance is noted at 1963.16, 1982.57, 1994.12
| Levels | Levels.1 |
|---|---|
| Previous Daily High | 1971.01 |
| Previous Daily Low | 1940.05 |
| Previous Weekly High | 1973.15 |
| Previous Weekly Low | 1938.15 |
| Previous Monthly High | 2079.76 |
| Previous Monthly Low | 1932.12 |
| Daily Fibonacci 38.2% | 1951.88 |
| Daily Fibonacci 61.8% | 1959.18 |
| Daily Pivot Point S1 | 1932.20 |
| Daily Pivot Point S2 | 1920.65 |
| Daily Pivot Point S3 | 1901.24 |
| Daily Pivot Point R1 | 1963.16 |
| Daily Pivot Point R2 | 1982.57 |
| Daily Pivot Point R3 | 1994.12 |
[/s2If]
Nehcap Expert Advisor
The NEHCAP MT4 EA is high quality professional trading system geared to generate returns without using GRID or martingales. Each trade has strict risk per trade parameter. The pairs under management include EURUSD, GBPUSD, AUDCAD, AUDNZD,GBPAUD, EURAUD, EURCAD, CHFJPY and many more.
The system is trading live: LIVE ACCOUNT TRACKING
You can run it free. Apply for a free trial and track our account. Buy the system or use profit share mechanism to generate returns on your MT4.
Join Our Telegram Group


