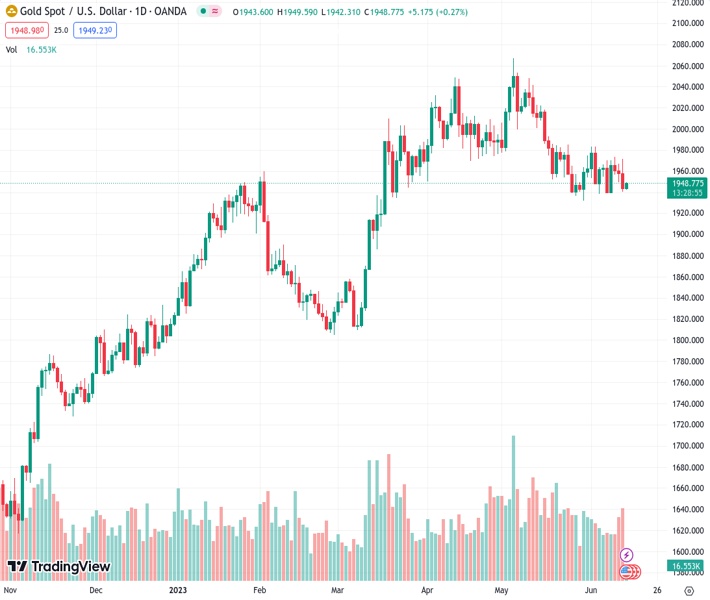
The price of gold at XAUUSD is 1,948.97 and has drawn the attention of several buyers who are close to the 100-day SMA, leading to a rebound of some of the losses suffered overnight.
…
This is a premium post.
[s2If !current_user_can(access_s2member_level4)]Please register for FREE REGISTER to read full post below containing analysis. In case of any error or you think you are not able to read the full post below, please email us at support#nehcap.com [lwa][/s2If] [s2If current_user_can(access_s2member_level1)]
- Gold price attracts some buyers near 100-day SMA and recovers a part of the overnight losses.
The pair currently trades last at 1948.97.
The previous day high was 1971.01 while the previous day low was 1940.05. The daily 38.2% Fib levels comes at 1951.88, expected to provide resistance. Similarly, the daily 61.8% fib level is at 1959.18, expected to provide resistance.
Gold price once again attracts some buyers near the 100-day Simple Moving Average (SMA) on Wednesday and recovers a part of the previous day’s slide to the weekly low. The XAG/USD sticks to its modest intraday gains heading into the European session and currently trades just above the $1,945 level, though remains well within a familiar range held over the past three weeks or so.
Soft consumer inflation figures released from the United States on Tuesday reaffirmed market bets for an imminent pause in the Federal Reserve’s (Fed) rate-hiking cycle, which, in turn, is seen lending some support to the Gold price. In fact, the US Labor Department reported that inflation, as measured by Consumer Price Index (CPI) barely rose in May and the year-on-year rate decelerated to the slowest pace since March 2021. The annual inflation print of 4.0%, meanwhile, is still twice the Fed’s 2% target and kept hopes alive for further policy tightening by the Fed.
It is worth recalling that the markets are still pricing in a greater chance of an additional 25 basis point (bps) lift-off at the July Federal Open Market Committee (FOMC) policy meeting. This was seen as a key factor behind the overnight sharp rise in the US Treasury bond yields, which is seen acting as a tailwind for the US Dollar (USD) and acting as a headwind for the non-yielding Gold price. The downside, however, remains cushioned as traders seem reluctant to place aggressive bets and prefer to wait on the sidelines ahead of the key central bank event risk.
The Fed is scheduled to announce its policy decision later during the US session, at 18:00 GMT and is widely expected to stand pat. Apart from this, market participants will closely scrutinize Fed Chair Jerome Powell’s comments at the post-meting press conference for clues about the future rate-hike path. The focus will then shift to the European Central Bank (ECB) policy meeting on Thursday, followed by the latest monetary policy update by the Bank of Japan (BoJ) on Friday. In the meantime, a softer risk tone might continue to lend support to the safe-haven Gold price.
From a technical perspective, the $1,942-$1,940 area, or the 100-day SMA, might continue to act as immediate strong support. A convincing break and acceptance below will be seen as a fresh trigger for bearish traders. Some follow-through selling below the May monthly swing low, around the $1,932 region, will reaffirm the negative bias and make the Gold price vulnerable to accelerate the fall towards the $1,900 round figure. The downward trajectory could get extended further and drag the XAU/USD towards the $1,876-$1,875 horizontal support en route to the very important 200-day SMA, currently around the $1,839 region.
On the flip side, any meaningful intraday appreciating move now seems to confront resistance near the $1,962-$1,964 region ahead of the $1,970-$1,972 supply zone. This is followed by the $1,983-$1,985 hurdle and the $2,000 psychological mark. A sustained strength beyond the latter will shift the bias in favour of bullish traders and lift the Gold price to the next relevant resistance near the $2,010-$2,012 region.
Technical Levels: Supports and Resistances
XAUUSD currently trading at 1946.33 at the time of writing. Pair opened at 1943.76 and is trading with a change of 0.13 % .
| Overview | Overview.1 | |
|---|---|---|
| 0 | Today last price | 1946.33 |
| 1 | Today Daily Change | 2.57 |
| 2 | Today Daily Change % | 0.13 |
| 3 | Today daily open | 1943.76 |
The pair is trading below its 20 Daily moving average @ 1959.74, below its 50 Daily moving average @ 1989.14 , above its 100 Daily moving average @ 1941.63 and above its 200 Daily moving average @ 1843.98
| Trends | Trends.1 | |
|---|---|---|
| 0 | Daily SMA20 | 1959.74 |
| 1 | Daily SMA50 | 1989.14 |
| 2 | Daily SMA100 | 1941.63 |
| 3 | Daily SMA200 | 1843.98 |
The previous day high was 1971.01 while the previous day low was 1940.05. The daily 38.2% Fib levels comes at 1951.88, expected to provide resistance. Similarly, the daily 61.8% fib level is at 1959.18, expected to provide resistance.
Note the levels of interest below:
- Pivot support is noted at 1932.2, 1920.65, 1901.24
- Pivot resistance is noted at 1963.16, 1982.57, 1994.12
| Levels | Levels.1 |
|---|---|
| Previous Daily High | 1971.01 |
| Previous Daily Low | 1940.05 |
| Previous Weekly High | 1973.15 |
| Previous Weekly Low | 1938.15 |
| Previous Monthly High | 2079.76 |
| Previous Monthly Low | 1932.12 |
| Daily Fibonacci 38.2% | 1951.88 |
| Daily Fibonacci 61.8% | 1959.18 |
| Daily Pivot Point S1 | 1932.20 |
| Daily Pivot Point S2 | 1920.65 |
| Daily Pivot Point S3 | 1901.24 |
| Daily Pivot Point R1 | 1963.16 |
| Daily Pivot Point R2 | 1982.57 |
| Daily Pivot Point R3 | 1994.12 |
[/s2If]
Nehcap Expert Advisor
The NEHCAP MT4 EA is high quality professional trading system geared to generate returns without using GRID or martingales. Each trade has strict risk per trade parameter. The pairs under management include EURUSD, GBPUSD, AUDCAD, AUDNZD,GBPAUD, EURAUD, EURCAD, CHFJPY and many more.
The system is trading live: LIVE ACCOUNT TRACKING
You can run it free. Apply for a free trial and track our account. Buy the system or use profit share mechanism to generate returns on your MT4.
Join Our Telegram Group


