The USDCHF pair at a rate of 0.90490 is currently staying neutral between the significant DMA levels due to lack of activity before the Federal Reserve’s decision. According to @nehcap’s perspective, it is anticipated to experience more decline.
…
This is a premium post.
[s2If !current_user_can(access_s2member_level4)]Please register for FREE REGISTER to read full post below containing analysis. In case of any error or you think you are not able to read the full post below, please email us at support#nehcap.com [lwa][/s2If] [s2If current_user_can(access_s2member_level1)]
- USD/CHF remains sidelined within the key DMA envelope amid pre-Fed inaction.
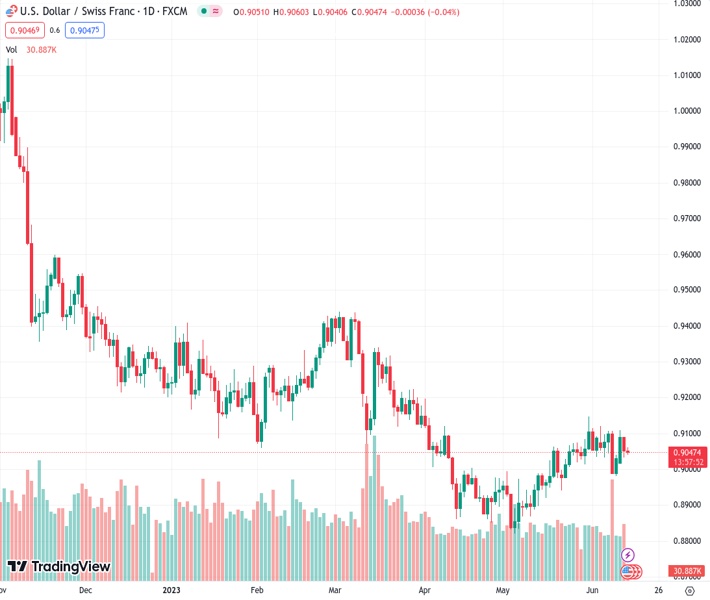
The pair currently trades last at 0.90490.
The previous day high was 0.909 while the previous day low was 0.9032. The daily 38.2% Fib levels comes at 0.9054, expected to provide resistance. Similarly, the daily 61.8% fib level is at 0.9068, expected to provide resistance.
USD/CHF aptly portrays the pre-Fed anxiety as it makes rounds to 0.9050 heading into Wednesday’s European session. In doing so, the Swiss Franc (CHF) pair dribbles between the 50-DMA and the 100-DMA while paring the weekly gains of late.
It should be noted that the impending bear cross on the MACD signals and the market’s cautious mood seems to have recently prod the USD/CHF bulls. Also likely to challenge the upside momentum is a jungle of resistances below 0.9130.
That said, the 0.9100 round figure guards the immediate upside of the USD/CHF pair ahead of convergence of the support-turned-resistance line stretched from May 04 and the 100-DMA, around 0.9115.
Following that, an 11-week-old falling resistance line and 50% Fibonacci retracement level of the pair’s March-May downside, close to the 0.9130 level, appears a tough nut to crack for the USD/CHF bulls.
It’s worth mentioning that the 0.9200 round figure, 61.8% Fibonacci retracement near 0.9205 and the late March swing high of 0.9225 act as additional upside filters for the bulls to cross for conviction.
Meanwhile, the 0.9000 psychological magnet puts a floor under the USD/CHF price. However, a daily closing below the 50-DMA support of around 0.8985 seems a more important level to confirm the pair’s further downside.
In a case where the quote remains bearish past 0.8985, the odds of witnessing a slump towards the yearly low marked in May around 0.8835 can’t be ruled out.
Trend: Further downside expected
Technical Levels: Supports and Resistances
USDCHF currently trading at 0.9055 at the time of writing. Pair opened at 0.9052 and is trading with a change of 0.03 % .
| Overview | Overview.1 | |
|---|---|---|
| 0 | Today last price | 0.9055 |
| 1 | Today Daily Change | 0.0003 |
| 2 | Today Daily Change % | 0.0300 |
| 3 | Today daily open | 0.9052 |
The pair is trading above its 20 Daily moving average @ 0.9047, above its 50 Daily moving average @ 0.8989 , below its 100 Daily moving average @ 0.9117 and below its 200 Daily moving average @ 0.935
| Trends | Trends.1 | |
|---|---|---|
| 0 | Daily SMA20 | 0.9047 |
| 1 | Daily SMA50 | 0.8989 |
| 2 | Daily SMA100 | 0.9117 |
| 3 | Daily SMA200 | 0.9350 |
The previous day high was 0.909 while the previous day low was 0.9032. The daily 38.2% Fib levels comes at 0.9054, expected to provide resistance. Similarly, the daily 61.8% fib level is at 0.9068, expected to provide resistance.
Note the levels of interest below:
- Pivot support is noted at 0.9026, 0.9, 0.8968
- Pivot resistance is noted at 0.9084, 0.9116, 0.9143
| Levels | Levels.1 |
|---|---|
| Previous Daily High | 0.9090 |
| Previous Daily Low | 0.9032 |
| Previous Weekly High | 0.9120 |
| Previous Weekly Low | 0.8984 |
| Previous Monthly High | 0.9148 |
| Previous Monthly Low | 0.8820 |
| Daily Fibonacci 38.2% | 0.9054 |
| Daily Fibonacci 61.8% | 0.9068 |
| Daily Pivot Point S1 | 0.9026 |
| Daily Pivot Point S2 | 0.9000 |
| Daily Pivot Point S3 | 0.8968 |
| Daily Pivot Point R1 | 0.9084 |
| Daily Pivot Point R2 | 0.9116 |
| Daily Pivot Point R3 | 0.9143 |
[/s2If]
Nehcap Expert Advisor
The NEHCAP MT4 EA is high quality professional trading system geared to generate returns without using GRID or martingales. Each trade has strict risk per trade parameter. The pairs under management include EURUSD, GBPUSD, AUDCAD, AUDNZD,GBPAUD, EURAUD, EURCAD, CHFJPY and many more.
The system is trading live: LIVE ACCOUNT TRACKING
You can run it free. Apply for a free trial and track our account. Buy the system or use profit share mechanism to generate returns on your MT4.
Join Our Telegram Group


