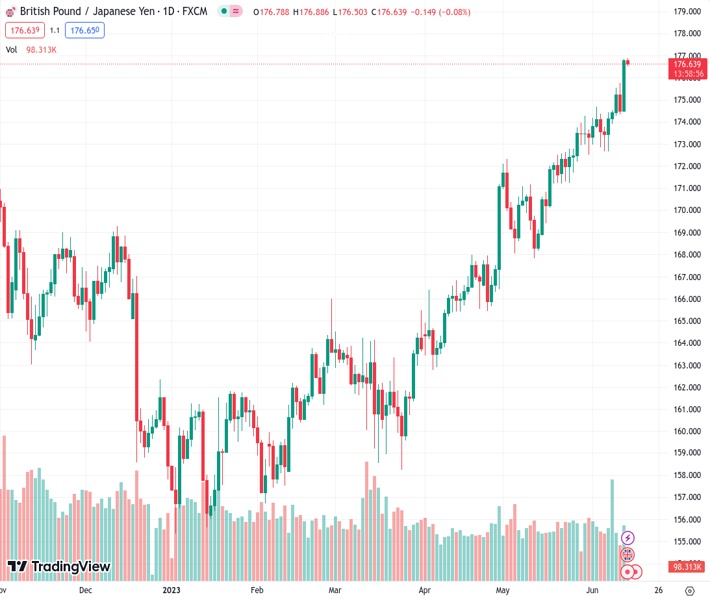
The GBPJPY at 176.647 is still stagnant at its peak level since January 2016.
…
This is a premium post.
[s2If !current_user_can(access_s2member_level4)]Please register for FREE REGISTER to read full post below containing analysis. In case of any error or you think you are not able to read the full post below, please email us at support#nehcap.com [lwa][/s2If] [s2If current_user_can(access_s2member_level1)]
- GBP/JPY remains sidelined at the highest levels since January 2016.
The pair currently trades last at 176.647.
The previous day high was 176.86 while the previous day low was 174.46. The daily 38.2% Fib levels comes at 175.95, expected to provide support. Similarly, the daily 61.8% fib level is at 175.38, expected to provide support.
GBP/JPY clings to minor losses around 176.70-80 as it pays little heed to the UK statistics amid early Wednesday morning in London. In doing so, the cross-currency pair consolidates the biggest daily jump in 1.5 months while making rounds to the highest levels since January 2016 marked the previous day.
Anxiety ahead of the Federal Reserve’s (Fed) monetary policy announcements and a light calendar in Asia allows the GBP/JPY bulls to catch a breather amid the early hours of the key day. Additionally, the mixed nature of the British data and lackluster Treasury bond yields also restrict the pair’s latest moves.
Talking about the UK statistics, the headline Gross Domestic Product (GDP) for April matches 0.2% growth versus -0.3% prior while the Industrial Production slumps during the stated month. That said, the Industrial Production also disappoints and so do the Index of Services for three months to April.
Also read: UK GDP expands 0.2% MoM in April vs. 0.2% expected
It should be observed that the British job numbers and inflation data have previously propelled the hawkish concerns about the Bank of England (BoE), which in turn keeps the British Pound (GBP) buyers hopeful despite the recently mixed UK data.
On the other hand, Japanese inflation numbers have been improving lately but the Bank of Japan (BoJ) officials keep defending the ultra-easy monetary policy meeting. Also likely to propel the GBP/JPY pair is a looming multi-billion-dollar worth of bond issue from the US Treasury Department due to the US debt-ceiling deal.
That said, the US 10-year Treasury bond yields retreat from the 13-day high of 3.83% to 3.80% whereas the two-year counterpart poked the highest levels in three months with the 4.70% mark before easing to 4.66% at the latest, which in turn checked the GBP/JPY bulls.
Moving on, GBP/JPY may stay on the front foot amid the BoE versus BoJ divergence but fears about the UK’s economic transition may allow the quote to witness intermediate jitters.
A daily closing beyond the previous resistance line from April 2022, near 176.50 by the press time, keeps the GBP/JPY pair buyers hopeful of meeting the 180.00 psychological magnet.
Technical Levels: Supports and Resistances
GBPJPY currently trading at 176.73 at the time of writing. Pair opened at 176.83 and is trading with a change of -0.06% % .
| Overview | Overview.1 | |
|---|---|---|
| 0 | Today last price | 176.73 |
| 1 | Today Daily Change | -0.10 |
| 2 | Today Daily Change % | -0.06% |
| 3 | Today daily open | 176.83 |
The pair remains strongly bullish on the daily timeframe. It trades above its 20 SMA @ 173.5, 50 SMA 170.08, 100 SMA @ 165.85 and 200 SMA @ 164.92.
| Trends | Trends.1 | |
|---|---|---|
| 0 | Daily SMA20 | 173.50 |
| 1 | Daily SMA50 | 170.08 |
| 2 | Daily SMA100 | 165.85 |
| 3 | Daily SMA200 | 164.92 |
The previous day high was 176.86 while the previous day low was 174.46. The daily 38.2% Fib levels comes at 175.95, expected to provide support. Similarly, the daily 61.8% fib level is at 175.38, expected to provide support.
Note the levels of interest below:
- Pivot support is noted at 175.24, 173.65, 172.84
- Pivot resistance is noted at 177.65, 178.46, 180.05
| Levels | Levels.1 |
|---|---|
| Previous Daily High | 176.86 |
| Previous Daily Low | 174.46 |
| Previous Weekly High | 175.54 |
| Previous Weekly Low | 172.67 |
| Previous Monthly High | 174.28 |
| Previous Monthly Low | 167.84 |
| Daily Fibonacci 38.2% | 175.95 |
| Daily Fibonacci 61.8% | 175.38 |
| Daily Pivot Point S1 | 175.24 |
| Daily Pivot Point S2 | 173.65 |
| Daily Pivot Point S3 | 172.84 |
| Daily Pivot Point R1 | 177.65 |
| Daily Pivot Point R2 | 178.46 |
| Daily Pivot Point R3 | 180.05 |
[/s2If]
Nehcap Expert Advisor
The NEHCAP MT4 EA is high quality professional trading system geared to generate returns without using GRID or martingales. Each trade has strict risk per trade parameter. The pairs under management include EURUSD, GBPUSD, AUDCAD, AUDNZD,GBPAUD, EURAUD, EURCAD, CHFJPY and many more.
The system is trading live: LIVE ACCOUNT TRACKING
You can run it free. Apply for a free trial and track our account. Buy the system or use profit share mechanism to generate returns on your MT4.
Join Our Telegram Group


