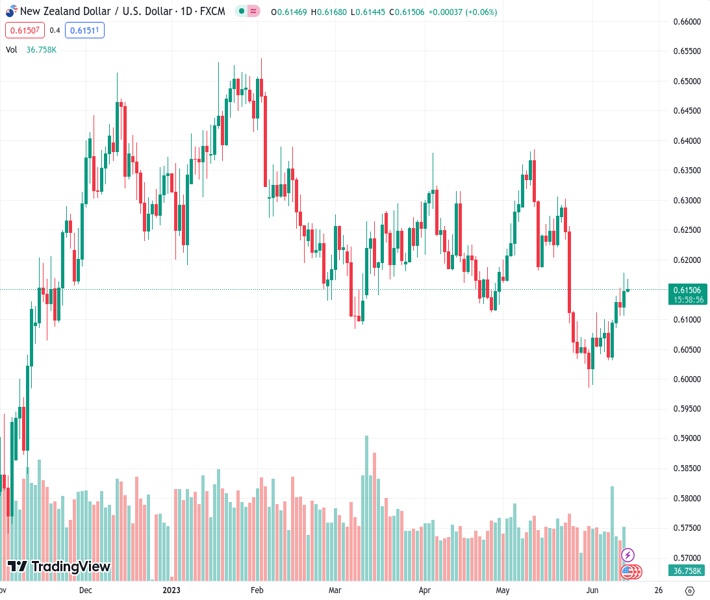
Although it has dropped compared to its three-week high, the NZDUSD at 0.61511 remains slightly in demand, despite its recent decline towards its intraday low. In the opinion of @nehcap, the market sentiment is optimistic.
…
This is a premium post.
[s2If !current_user_can(access_s2member_level4)]Please register for FREE REGISTER to read full post below containing analysis. In case of any error or you think you are not able to read the full post below, please email us at support#nehcap.com [lwa][/s2If] [s2If current_user_can(access_s2member_level1)]
- NZD/USD retreats from three-week high, stays mildly bid despite the latest fall toward intraday low.
The pair currently trades last at 0.61511.
The previous day high was 0.6178 while the previous day low was 0.6106. The daily 38.2% Fib levels comes at 0.615, expected to provide support. Similarly, the daily 61.8% fib level is at 0.6134, expected to provide support.
NZD/USD pares intraday gains, the fifth in a row, as bulls catch a breather at the highest level in three weeks heading into Wednesday’s European session. In doing so, the Kiwi pare reverses from the 200-SMA as market positions for the US Federal Reserve (Fed) Interest Rate Decision amid escalating hopes of no rate hike after witnessing 10 consecutive lifts in the Fed rates. With this, the quote stays depressed near 0.6155 despite posting mild gains at the latest.
Also read: NZD/USD bulls step in ahead of the Fed
In addition to the failure to cross the 200-bar Simple Moving Average (SMA), the NZD/USD pair’s pullback also takes clues from the overbought RSI (14) line. However, a one-week-old ascending trend channel keeps the Kiwi pair buyers hopeful.
Hence, the quote’s latest weakness can challenge the short-term bullish chart formation by poking the 0.6130 support with eyes on the 100-SMA support surrounding 0.6085.
It’s worth mentioning that multiple levels marked since late May highlights 0.6030-25 as the last defense of the NZD/USD buyers.
On the contrary, the aforementioned 200-SMA restricts immediate upside of the NZD/USD pair near 0.6175.
Following that, the 61.8% Fibonacci retracement level of the pair’s May 19-31 downside, near 0.6185, will precede the previously stated channel’s top line, near 0.6205, to challenge the bulls.
Trend: Bullish
Technical Levels: Supports and Resistances
NZDUSD currently trading at 0.6152 at the time of writing. Pair opened at 0.6149 and is trading with a change of 0.05% % .
| Overview | Overview.1 | |
|---|---|---|
| 0 | Today last price | 0.6152 |
| 1 | Today Daily Change | 0.0003 |
| 2 | Today Daily Change % | 0.05% |
| 3 | Today daily open | 0.6149 |
The pair is trading above its 20 Daily moving average @ 0.6115, below its 50 Daily moving average @ 0.6182 , below its 100 Daily moving average @ 0.6226 and above its 200 Daily moving average @ 0.615
| Trends | Trends.1 | |
|---|---|---|
| 0 | Daily SMA20 | 0.6115 |
| 1 | Daily SMA50 | 0.6182 |
| 2 | Daily SMA100 | 0.6226 |
| 3 | Daily SMA200 | 0.6150 |
The previous day high was 0.6178 while the previous day low was 0.6106. The daily 38.2% Fib levels comes at 0.615, expected to provide support. Similarly, the daily 61.8% fib level is at 0.6134, expected to provide support.
Note the levels of interest below:
- Pivot support is noted at 0.6111, 0.6072, 0.6039
- Pivot resistance is noted at 0.6183, 0.6216, 0.6255
| Levels | Levels.1 |
|---|---|
| Previous Daily High | 0.6178 |
| Previous Daily Low | 0.6106 |
| Previous Weekly High | 0.6143 |
| Previous Weekly Low | 0.6026 |
| Previous Monthly High | 0.6385 |
| Previous Monthly Low | 0.5985 |
| Daily Fibonacci 38.2% | 0.6150 |
| Daily Fibonacci 61.8% | 0.6134 |
| Daily Pivot Point S1 | 0.6111 |
| Daily Pivot Point S2 | 0.6072 |
| Daily Pivot Point S3 | 0.6039 |
| Daily Pivot Point R1 | 0.6183 |
| Daily Pivot Point R2 | 0.6216 |
| Daily Pivot Point R3 | 0.6255 |
[/s2If]
Nehcap Expert Advisor
The NEHCAP MT4 EA is high quality professional trading system geared to generate returns without using GRID or martingales. Each trade has strict risk per trade parameter. The pairs under management include EURUSD, GBPUSD, AUDCAD, AUDNZD,GBPAUD, EURAUD, EURCAD, CHFJPY and many more.
The system is trading live: LIVE ACCOUNT TRACKING
You can run it free. Apply for a free trial and track our account. Buy the system or use profit share mechanism to generate returns on your MT4.
Join Our Telegram Group


