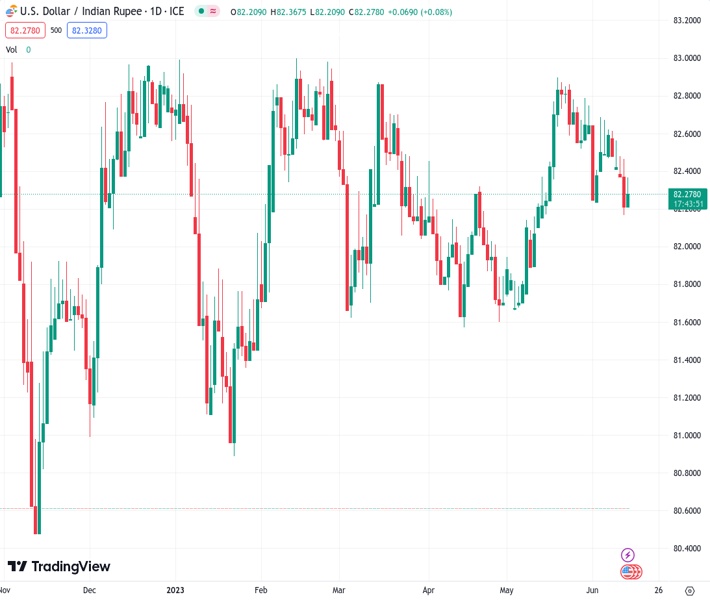
During Wednesday’s Asian session, USDINR fluctuated within a tight trading range around 82.2975.
…
This is a premium post.
[s2If !current_user_can(access_s2member_level4)]Please register for FREE REGISTER to read full post below containing analysis. In case of any error or you think you are not able to read the full post below, please email us at support#nehcap.com [lwa][/s2If] [s2If current_user_can(access_s2member_level1)]
- USD/INR oscillates in a narrow trading band through the Asian session on Wednesday.
The pair currently trades last at 82.2975.
The previous day high was 82.4932 while the previous day low was 82.1575. The daily 38.2% Fib levels comes at 82.2857, expected to provide support. Similarly, the daily 61.8% fib level is at 82.3649, expected to provide resistance.
The USD/INR pair struggles to gain any meaningful traction on Wednesday and seesaws between tepid gains/minor losses through the Asian session. The pair currently trades around the 82.25-82.30 region, nearly unchanged for the day, and remains well within the striking distance of its lowest level since May 16 touched on Tuesday.
From a technical perspective, the USD/INR pair, so far, has been showing some resilience below the 100-day Simple Moving Average (SMA) and the 38.2% Fibonacci retracement level of the April-May rally. This makes it prudent to wait for some follow-through selling below the overnight swing low, around the 82.15 area, before placing fresh bearish bets. This is closely followed by the 82.00 confluence, comprising the very important 200-day SMA and the 61.8% Fibo. level.
A convincing break below the latter will mark a fresh breakdown and set the stage for an extension of the recent pullback from the vicinity of the 83.00 round figure. With oscillators on the daily chart just starting to gain negative traction, the USD/INR pair might then accelerate the downfall towards the 81.75 intermediate support en route to the March/April swing low, around 81.50 strong horizontal support.
On the flip side, the 38.2% Fibo. level, around the 82.40 region, now seems to act as an immediate hurdle. The next relevant resistance is pegged near the 82.60-82.65 zone, or the 23.6% Fibo. level, which if cleared might trigger a short-covering move. The USD/INR pair might then make a fresh attempt to conquer the 83.00 round-figure mark. Bulls might eventually aim to challenge the all-time high, around the 83.40-83.45 area touched in October 2022.
Technical Levels: Supports and Resistances
USDINR currently trading at 82.2932 at the time of writing. Pair opened at 82.2892 and is trading with a change of 0.0 % .
| Overview | Overview.1 | |
|---|---|---|
| 0 | Today last price | 82.2932 |
| 1 | Today Daily Change | 0.0040 |
| 2 | Today Daily Change % | 0.0000 |
| 3 | Today daily open | 82.2892 |
The pair is trading below its 20 Daily moving average @ 82.5791, above its 50 Daily moving average @ 82.2005 , above its 100 Daily moving average @ 82.2688 and above its 200 Daily moving average @ 82.016
| Trends | Trends.1 | |
|---|---|---|
| 0 | Daily SMA20 | 82.5791 |
| 1 | Daily SMA50 | 82.2005 |
| 2 | Daily SMA100 | 82.2688 |
| 3 | Daily SMA200 | 82.0160 |
The previous day high was 82.4932 while the previous day low was 82.1575. The daily 38.2% Fib levels comes at 82.2857, expected to provide support. Similarly, the daily 61.8% fib level is at 82.3649, expected to provide resistance.
Note the levels of interest below:
- Pivot support is noted at 82.1334, 81.9776, 81.7978
- Pivot resistance is noted at 82.4691, 82.6489, 82.8047
| Levels | Levels.1 |
|---|---|
| Previous Daily High | 82.4932 |
| Previous Daily Low | 82.1575 |
| Previous Weekly High | 82.7120 |
| Previous Weekly Low | 82.4030 |
| Previous Monthly High | 82.9810 |
| Previous Monthly Low | 81.6435 |
| Daily Fibonacci 38.2% | 82.2857 |
| Daily Fibonacci 61.8% | 82.3649 |
| Daily Pivot Point S1 | 82.1334 |
| Daily Pivot Point S2 | 81.9776 |
| Daily Pivot Point S3 | 81.7978 |
| Daily Pivot Point R1 | 82.4691 |
| Daily Pivot Point R2 | 82.6489 |
| Daily Pivot Point R3 | 82.8047 |
[/s2If]
Nehcap Expert Advisor
The NEHCAP MT4 EA is high quality professional trading system geared to generate returns without using GRID or martingales. Each trade has strict risk per trade parameter. The pairs under management include EURUSD, GBPUSD, AUDCAD, AUDNZD,GBPAUD, EURAUD, EURCAD, CHFJPY and many more.
The system is trading live: LIVE ACCOUNT TRACKING
You can run it free. Apply for a free trial and track our account. Buy the system or use profit share mechanism to generate returns on your MT4.
Join Our Telegram Group


