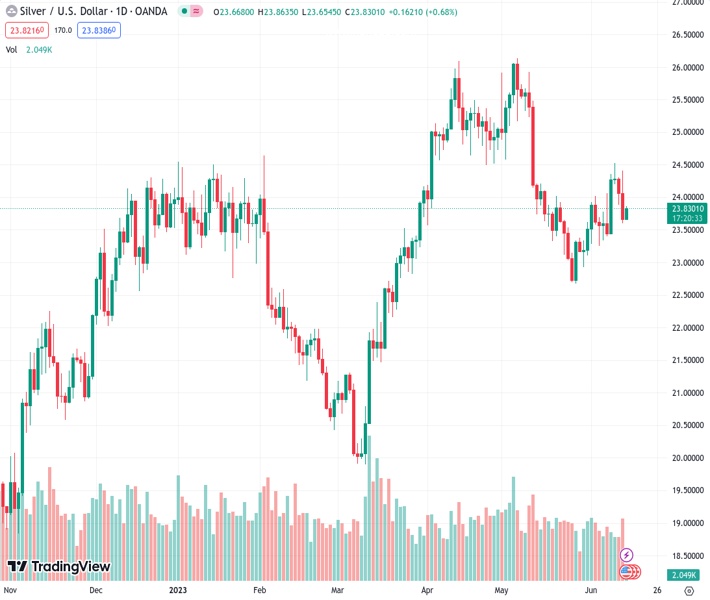
On Wednesday, there was an influx of new buyers for silver which ended its two-day losing streak. The XAGUSD reached a price of 23.819.
…
This is a premium post.
[s2If !current_user_can(access_s2member_level4)]Please register for FREE REGISTER to read full post below containing analysis. In case of any error or you think you are not able to read the full post below, please email us at support#nehcap.com [lwa][/s2If] [s2If current_user_can(access_s2member_level1)]
- Silver attracts fresh buyers on Wednesday and snaps a two-day losing streak.
The pair currently trades last at 23.819.
The previous day high was 24.4 while the previous day low was 23.6. The daily 38.2% Fib levels comes at 23.91, expected to provide resistance. Similarly, the daily 61.8% fib level is at 24.1, expected to provide resistance.
Silver regains positive traction during the Asian session on Wednesday, snapping a two-day losing streak and stalling the overnight sharp retracement slide from the vicinity of mid-$24.00s. The white metal is currently placed near the top end of its intraday trading range, around the $23.80 region, though seems to struggle to capitalize on the strength beyond the 200-hour Simple Moving Average (SMA).
From a technical perspective, the recent repeated failures near the 50% Fibonacci retracement level of the downfall witnessed in May and the subsequent break below the $24.00 mark favours bearish traders. This, along with the fact that oscillators on the daily chart have just started drifting in the negative territory, supports prospects for a further near-term depreciating move. That said, it will still be prudent to wait for some follow-through selling below the 23.6% Fibo. support, around the $23.55-$23.50 region, before placing fresh bets.
The XAG/USD might then turn vulnerable to weaken further below the monthly low, around the $23.25 region, and accelerate the slide towards the $23-.00 round figure. Some follow-through selling will expose the $22.70-$22.65 area, or a two-month low touched in May before the commodity eventually drops to test the $22.00 mark.
On the flip side, the $24.00 mark, which coincides with the 38.2% Fibo. level now seems to act as an immediate hurdle. Any further move up might continue to attract fresh sellers and remain capped near the $24.50-$24.55 supply zone, or the 50% Fibo. level. A convincing breakthrough, however, should allow the XAG/USD to aim to reclaim the $25.00 psychological mark and accelerate the positive momentum further towards the $25.35-$25.40 resistance zone. Bulls might then make a fresh attempt towards conquering the $26.00 round figure.
Technical Levels: Supports and Resistances
XAGUSD currently trading at 23.82 at the time of writing. Pair opened at 23.67 and is trading with a change of 0.63 % .
| Overview | Overview.1 | |
|---|---|---|
| 0 | Today last price | 23.82 |
| 1 | Today Daily Change | 0.15 |
| 2 | Today Daily Change % | 0.63 |
| 3 | Today daily open | 23.67 |
The pair is trading above its 20 Daily moving average @ 23.58, below its 50 Daily moving average @ 24.49 , above its 100 Daily moving average @ 23.35 and above its 200 Daily moving average @ 22.32
| Trends | Trends.1 | |
|---|---|---|
| 0 | Daily SMA20 | 23.58 |
| 1 | Daily SMA50 | 24.49 |
| 2 | Daily SMA100 | 23.35 |
| 3 | Daily SMA200 | 22.32 |
The previous day high was 24.4 while the previous day low was 23.6. The daily 38.2% Fib levels comes at 23.91, expected to provide resistance. Similarly, the daily 61.8% fib level is at 24.1, expected to provide resistance.
Note the levels of interest below:
- Pivot support is noted at 23.38, 23.09, 22.58
- Pivot resistance is noted at 24.18, 24.7, 24.99
| Levels | Levels.1 |
|---|---|
| Previous Daily High | 24.40 |
| Previous Daily Low | 23.60 |
| Previous Weekly High | 24.53 |
| Previous Weekly Low | 23.25 |
| Previous Monthly High | 26.14 |
| Previous Monthly Low | 22.68 |
| Daily Fibonacci 38.2% | 23.91 |
| Daily Fibonacci 61.8% | 24.10 |
| Daily Pivot Point S1 | 23.38 |
| Daily Pivot Point S2 | 23.09 |
| Daily Pivot Point S3 | 22.58 |
| Daily Pivot Point R1 | 24.18 |
| Daily Pivot Point R2 | 24.70 |
| Daily Pivot Point R3 | 24.99 |
[/s2If]
Nehcap Expert Advisor
The NEHCAP MT4 EA is high quality professional trading system geared to generate returns without using GRID or martingales. Each trade has strict risk per trade parameter. The pairs under management include EURUSD, GBPUSD, AUDCAD, AUDNZD,GBPAUD, EURAUD, EURCAD, CHFJPY and many more.
The system is trading live: LIVE ACCOUNT TRACKING
You can run it free. Apply for a free trial and track our account. Buy the system or use profit share mechanism to generate returns on your MT4.
Join Our Telegram Group


