The USD/MXN pair has experienced a decline of 0.30% due to the reduction in US headline inflation, which is likely to prompt the Fed to halt its activities in June.
…
This is a premium post.
[s2If !current_user_can(access_s2member_level4)]Please register for FREE REGISTER to read full post below containing analysis. In case of any error or you think you are not able to read the full post below, please email us at support#nehcap.com [lwa][/s2If] [s2If current_user_can(access_s2member_level1)]
- USD/MXN falls over 0.30% as US headline inflation drops, encouraging Fed’s likely pause in June.
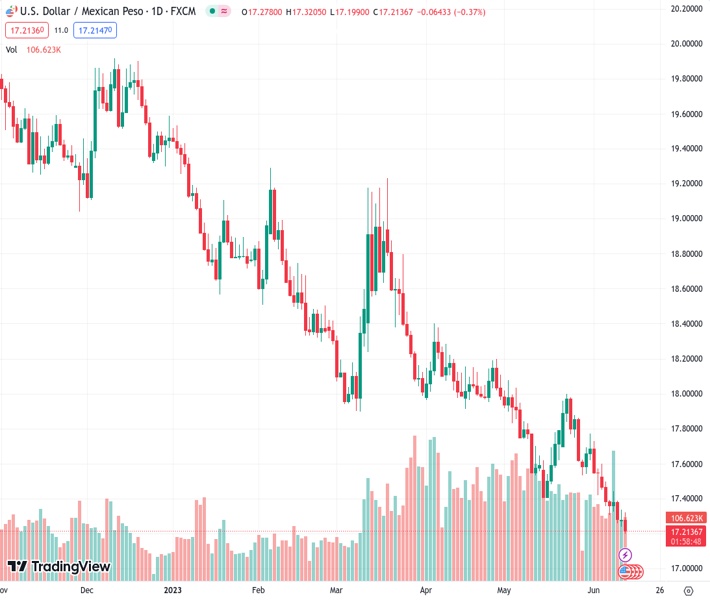
The pair currently trades last at 17.2123.
The previous day high was 17.3353 while the previous day low was 17.2415. The daily 38.2% Fib levels comes at 17.2994, expected to provide resistance. Similarly, the daily 61.8% fib level is at 17.2773, expected to provide resistance.
USD/MXN tumbles to fresh seven-year lows, achieved during the last six trading days, courtesy of US Dollar (USD) weakness. A US inflation report sent the US Dollar sliding against most G10 FX peers, alongside the Mexican Peso (MXN). At the time of writing, the USD/MXN is trading at 17.2164, down more than 0.30%.
The market sentiment remains upbeat, a positive sign for the Mexican Peso, which is seen as a risk-sensitive currency. May inflation in the US flashed signs of cooling down, with headline inflation, known as the Consumer Price Index (CPI), dropping 0.8% from April’s 4.9% to 4% YoY. Additionally, excluding volatile items like food and energy, also known as Core CPI, edged lower, 0.2% to 5.3% YoY, aligned with estimates. However, core CPI month-over-month (MoM) remained unchanged for the second straight month, indicating that inflation still lingers in the economy.
Following the data release, the US Dollar Index (DXY), which measures the buck’s value against a basket of its rivals, dives 0.27% at 103.347 after hitting three-week lows. At the same time, US Treasury bond yields, particularly the 10-year benchmark note, are at 3.827%, eight basis points higher than its opening price.
That said, Wall Street expects the Fed to pause in June but is likely to resume in July, according to the latest figures reported by the CME FedWatch Tool. Money market futures odds for a quarter percentage increase to the Federal Funds Rate (FFR) are 62.5% and continue to aim up compared to the last week.
In tomorrow’s Federal Reserve Open Market Committee (FOMC)meeting, the Federal Reserve will also update the Summary of Economic Projections (SEP) and the Dot-Plot, which is foreseen to cement the Fed’s hawkish stance, not as a dovish pivot.
Across the border, the Mexican economic docket was absent. Still, the latest remarks by the Bank of Mexico (Banxico) Governors, Victoria Rodriguez Ceja and Jonathan Heath, stressed the need to hold higher rates for at least two meetings.
On Wednesday, the US economic agenda will feature May’s Producer Price Index (PPI), the FOMC’s decision, and Fed’s Chair Jerome Powell’s press conference.
The USD/MXN is set to continue to drop further, pending decisively cracking the 17.2000 mark, albeit hitting a new YTD low of 17.1990. Though a daily close below the latter would send the USD/MXN plummeting toward the 2016 low of 17.0500 before challenging the 17.00 mark. Conversely, if USD/MXN pierces May’s low turned support at 17.4038, that could open the door for a recovery toward the 50-day Exponential Moving Average (EMA) at 17.5166.
Technical Levels: Supports and Resistances
USDMXN currently trading at 17.2135 at the time of writing. Pair opened at 17.2832 and is trading with a change of -0.4 % .
| Overview | Overview.1 | |
|---|---|---|
| 0 | Today last price | 17.2135 |
| 1 | Today Daily Change | -0.0697 |
| 2 | Today Daily Change % | -0.4000 |
| 3 | Today daily open | 17.2832 |
The pair remains strongly bearish on the daily time frame. It trades below the 20 SMA @ 17.5988, 50 SMA 17.8169, 100 SMA @ 18.1663 and 200 SMA @ 18.904.
| Trends | Trends.1 | |
|---|---|---|
| 0 | Daily SMA20 | 17.5988 |
| 1 | Daily SMA50 | 17.8169 |
| 2 | Daily SMA100 | 18.1663 |
| 3 | Daily SMA200 | 18.9040 |
The previous day high was 17.3353 while the previous day low was 17.2415. The daily 38.2% Fib levels comes at 17.2994, expected to provide resistance. Similarly, the daily 61.8% fib level is at 17.2773, expected to provide resistance.
Note the levels of interest below:
- Pivot support is noted at 17.2381, 17.1929, 17.1443
- Pivot resistance is noted at 17.3319, 17.3805, 17.4256
| Levels | Levels.1 |
|---|---|
| Previous Daily High | 17.3353 |
| Previous Daily Low | 17.2415 |
| Previous Weekly High | 17.5981 |
| Previous Weekly Low | 17.2591 |
| Previous Monthly High | 18.0780 |
| Previous Monthly Low | 17.4203 |
| Daily Fibonacci 38.2% | 17.2994 |
| Daily Fibonacci 61.8% | 17.2773 |
| Daily Pivot Point S1 | 17.2381 |
| Daily Pivot Point S2 | 17.1929 |
| Daily Pivot Point S3 | 17.1443 |
| Daily Pivot Point R1 | 17.3319 |
| Daily Pivot Point R2 | 17.3805 |
| Daily Pivot Point R3 | 17.4256 |
[/s2If]
Nehcap Expert Advisor
The NEHCAP MT4 EA is high quality professional trading system geared to generate returns without using GRID or martingales. Each trade has strict risk per trade parameter. The pairs under management include EURUSD, GBPUSD, AUDCAD, AUDNZD,GBPAUD, EURAUD, EURCAD, CHFJPY and many more.
The system is trading live: LIVE ACCOUNT TRACKING
You can run it free. Apply for a free trial and track our account. Buy the system or use profit share mechanism to generate returns on your MT4.
Join Our Telegram Group


