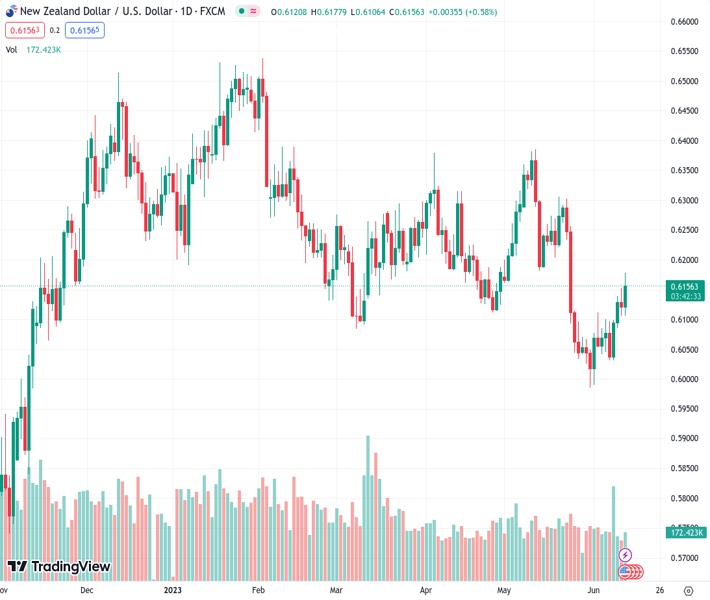
The NZDUSD currency pair rose to 0.6177 and is currently trading above the 200-day SMA.
…
This is a premium post.
[s2If !current_user_can(access_s2member_level4)]Please register for FREE REGISTER to read full post below containing analysis. In case of any error or you think you are not able to read the full post below, please email us at support#nehcap.com [lwa][/s2If] [s2If current_user_can(access_s2member_level1)]
- The NZD/USD jumped to 0.6177 and holds above the 200-day SMA.
The pair currently trades last at 0.61555.
The previous day high was 0.6154 while the previous day low was 0.6105. The daily 38.2% Fib levels comes at 0.6135, expected to provide support. Similarly, the daily 61.8% fib level is at 0.6124, expected to provide support.
In Tuesday’s session, the NZD/USD managed to jump above the 200-day to a high of 0.6177 but retreated to 0.6145 as the US Dollar lost strength following the release of the May Consumer Price Index (CPI). As the data came in below expectations, market participants are fully discounting that the Federal Reserve will not raise interest rates on Wednesday.
The US Bureau of Labor Statistics released the Consumer Price Index (CPI) for May, which fell slightly below expectations. The headline figure declined to 4% YoY, compared to the expected 4.1%, while the Core measure matched expectations at 5.3% YoY. The monthly measures from both the CPI and Core CPI rose by 0.1% and 0.4%, respectively.
Following the release of the data, markets have fully priced a pause at the upcoming Federal Reserve meeting on Wednesday, which seems to be weakening the Greenback. Attention now turns to clues on forward guidance. The CME FedWatch Tool suggests that investors are betting on a 63% probability of a rate hike in July.
In addition, the release of updated macroeconomic forecasts and dot plots from the Federal Open Market Committee (FOMC) will also contribute to the shaping of expectations of future Fed meetings.
According to the daily chart, the technical outlook of the NZD/USD has turned bullish for the short term as indicators jumped to positive territory, suggesting that the buyers now have the upper hand. The Relative Strength Index (RSI) jumped above its midline while the Moving Average Convergence Divergence (MACD) prints rising green bars. However, the bearish cross performed between the 20 and 200-day SMA’s may limit the NZD/USD upside’s potential in the following sessions.
On the upside, resistance levels can be found at the daily highs around 0.6177, followed by the 0.6200 psychological mark and the 100-day Simple Moving Average (SMA) near 0.6220. On the other hand, supports line up at the 200-day SMA at 0.6150 (former resistance) and below at the 20-day SMA at 0.6120 and the 0.6100 zone.
Technical Levels: Supports and Resistances
NZDUSD currently trading at 0.6155 at the time of writing. Pair opened at 0.6123 and is trading with a change of 0.52 % .
| Overview | Overview.1 | |
|---|---|---|
| 0 | Today last price | 0.6155 |
| 1 | Today Daily Change | 0.0032 |
| 2 | Today Daily Change % | 0.5200 |
| 3 | Today daily open | 0.6123 |
The pair is trading above its 20 Daily moving average @ 0.6119, below its 50 Daily moving average @ 0.6185 , below its 100 Daily moving average @ 0.623 and above its 200 Daily moving average @ 0.6149
| Trends | Trends.1 | |
|---|---|---|
| 0 | Daily SMA20 | 0.6119 |
| 1 | Daily SMA50 | 0.6185 |
| 2 | Daily SMA100 | 0.6230 |
| 3 | Daily SMA200 | 0.6149 |
The previous day high was 0.6154 while the previous day low was 0.6105. The daily 38.2% Fib levels comes at 0.6135, expected to provide support. Similarly, the daily 61.8% fib level is at 0.6124, expected to provide support.
Note the levels of interest below:
- Pivot support is noted at 0.6101, 0.6078, 0.6052
- Pivot resistance is noted at 0.615, 0.6176, 0.6199
| Levels | Levels.1 |
|---|---|
| Previous Daily High | 0.6154 |
| Previous Daily Low | 0.6105 |
| Previous Weekly High | 0.6143 |
| Previous Weekly Low | 0.6026 |
| Previous Monthly High | 0.6385 |
| Previous Monthly Low | 0.5985 |
| Daily Fibonacci 38.2% | 0.6135 |
| Daily Fibonacci 61.8% | 0.6124 |
| Daily Pivot Point S1 | 0.6101 |
| Daily Pivot Point S2 | 0.6078 |
| Daily Pivot Point S3 | 0.6052 |
| Daily Pivot Point R1 | 0.6150 |
| Daily Pivot Point R2 | 0.6176 |
| Daily Pivot Point R3 | 0.6199 |
[/s2If]
Nehcap Expert Advisor
The NEHCAP MT4 EA is high quality professional trading system geared to generate returns without using GRID or martingales. Each trade has strict risk per trade parameter. The pairs under management include EURUSD, GBPUSD, AUDCAD, AUDNZD,GBPAUD, EURAUD, EURCAD, CHFJPY and many more.
The system is trading live: LIVE ACCOUNT TRACKING
You can run it free. Apply for a free trial and track our account. Buy the system or use profit share mechanism to generate returns on your MT4.
Join Our Telegram Group


