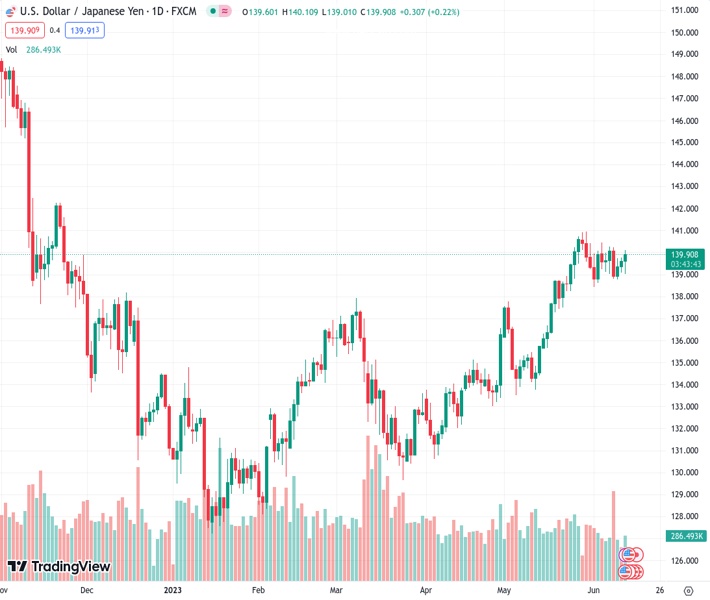
The USDJPY is currently trading at approximately 139.90s following the publication of the US CPI report.
…
This is a premium post.
[s2If !current_user_can(access_s2member_level4)]Please register for FREE REGISTER to read full post below containing analysis. In case of any error or you think you are not able to read the full post below, please email us at support#nehcap.com [lwa][/s2If] [s2If current_user_can(access_s2member_level1)]
- USD/JPY trades at around 139.90s after the release of the US CPI report.
The pair currently trades last at 139.888.
The previous day high was 139.77 while the previous day low was 139.06. The daily 38.2% Fib levels comes at 139.5, expected to provide support. Similarly, the daily 61.8% fib level is at 139.33, expected to provide support.
USD/JPY rose after the release of the US inflation report in the United States (US) and cemented the case for a Federal Reserve (Fed) pause on its tightening cycle after increasing rates by 500 basis points since March 2022. At the time of writing, USD/JPY trades at 139.90, shy of challenging the 140.00 mark.
Inflation in the US flashed signs of cooling down in the headline figure, but the core remains stickier. The US Department of Labor revealed the Consumer Price Index (CPI) in May rose by 4% YoY, beneath estimates and less than April’s 4.9%. CPI has printed a lower reading than the previous month for twelve straight months, strengthening the case for a Fed pause.
Nevertheless, core CPI, which excludes volatile items like food and energy, increased to 5.3% YoY, aligned with estimates, but 0.2% below the prior’s month data. Money market futures speculate that Jerome Powell and Co. would increase rates at the July meeting by 25 basis points (bps) to 5.25%-5.50%, as shown by the CME FedWatch Tool, with chances at 58.2%, higher than a week ago.
Following the data release, the USD/JPY seesawed around the 139.00-140.00 area before stabilizing around current exchange rates. Meanwhile, post the US CPI release, US Treasury bond yields are rising, with the 10-year note yielding 3.790%, gaining five basis points (bps), a tailwind for the USD/JPY.
The US Dollar Index (DXY), a measure that tracks the buck’s value against a basket of six currencies, drops 0.34%, exchanges hands at 103.201, its lowest level since May 23, at three-week lows.
The US economic docket will feature May Producer Price Index (PPI), followed by the US Federal Reserve Open Market Committee (FOMC) monetary policy decision and the Fed Chair Powell press conference.
From a daily chart perspective, the USD/JPY pair is neutral to slightly tilted upwards as it sits above the daily Exponential Moving Averages (EMAs). Nevertheless, for a bullish continuation, the USD/JPY must break above the 140.00 mark, so it can threaten the next resistance at the year-to-date (YTD) high of 140.91 before cracking 142.00. Conversely, the USD/JPY could pull back if it breaks below the 20-day EMA at 138.88, exposing as the next demand zone, the month-to-date (MTD) low of 138.42.
Technical Levels: Supports and Resistances
USDJPY currently trading at 139.94 at the time of writing. Pair opened at 139.6 and is trading with a change of 0.24 % .
| Overview | Overview.1 | |
|---|---|---|
| 0 | Today last price | 139.94 |
| 1 | Today Daily Change | 0.34 |
| 2 | Today Daily Change % | 0.24 |
| 3 | Today daily open | 139.60 |
The pair remains strongly bullish on the daily timeframe. It trades above its 20 SMA @ 139.18, 50 SMA 136.2, 100 SMA @ 134.59 and 200 SMA @ 137.29.
| Trends | Trends.1 | |
|---|---|---|
| 0 | Daily SMA20 | 139.18 |
| 1 | Daily SMA50 | 136.20 |
| 2 | Daily SMA100 | 134.59 |
| 3 | Daily SMA200 | 137.29 |
The previous day high was 139.77 while the previous day low was 139.06. The daily 38.2% Fib levels comes at 139.5, expected to provide support. Similarly, the daily 61.8% fib level is at 139.33, expected to provide support.
Note the levels of interest below:
- Pivot support is noted at 139.19, 138.78, 138.49
- Pivot resistance is noted at 139.89, 140.18, 140.59
| Levels | Levels.1 |
|---|---|
| Previous Daily High | 139.77 |
| Previous Daily Low | 139.06 |
| Previous Weekly High | 140.45 |
| Previous Weekly Low | 138.76 |
| Previous Monthly High | 140.93 |
| Previous Monthly Low | 133.50 |
| Daily Fibonacci 38.2% | 139.50 |
| Daily Fibonacci 61.8% | 139.33 |
| Daily Pivot Point S1 | 139.19 |
| Daily Pivot Point S2 | 138.78 |
| Daily Pivot Point S3 | 138.49 |
| Daily Pivot Point R1 | 139.89 |
| Daily Pivot Point R2 | 140.18 |
| Daily Pivot Point R3 | 140.59 |
[/s2If]
Nehcap Expert Advisor
The NEHCAP MT4 EA is high quality professional trading system geared to generate returns without using GRID or martingales. Each trade has strict risk per trade parameter. The pairs under management include EURUSD, GBPUSD, AUDCAD, AUDNZD,GBPAUD, EURAUD, EURCAD, CHFJPY and many more.
The system is trading live: LIVE ACCOUNT TRACKING
You can run it free. Apply for a free trial and track our account. Buy the system or use profit share mechanism to generate returns on your MT4.
Join Our Telegram Group


