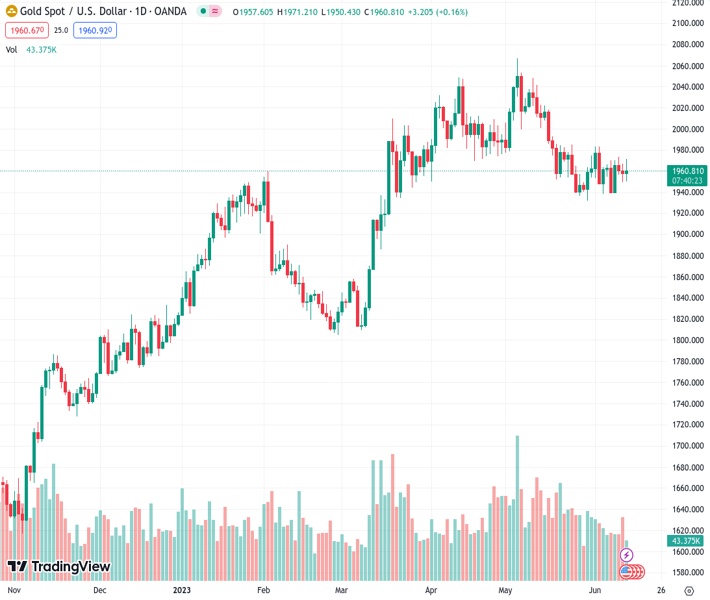
The price of gold (XAUUSD) is currently at 1,961.73. The May US annual CPI has fallen to 4%, marking the lowest figure since March 2021.
…
This is a premium post.
[s2If !current_user_can(access_s2member_level4)]Please register for FREE REGISTER to read full post below containing analysis. In case of any error or you think you are not able to read the full post below, please email us at support#nehcap.com [lwa][/s2If] [s2If current_user_can(access_s2member_level1)]
- The US annual CPI dropped in May to 4%, which is the lowest since March 2021.
The pair currently trades last at 1961.73.
The previous day high was 1967.05 while the previous day low was 1949.26. The daily 38.2% Fib levels comes at 1956.06, expected to provide support. Similarly, the daily 61.8% fib level is at 1960.25, expected to provide support.
Gold Price bounced sharply from $1,950 to the $1,970 area following the release of US inflation data. It is trading near daily highs, supported by a broad-based decline in the US dollar.
The US Consumer Price Index rose 0.1% in May, which was below the expected increase of 0.2%, and the annual rate fell from 4.9% to 4.0%, reaching the lowest level since March 2021. The Core CPI advanced 0.4%, in line with expectations, and the annual rate fell from 5.5% in April to 5.3% in May.
These numbers have cemented expectations of a pause on Wednesday from the Federal Reserve. More inflation data is due tomorrow with the Producer Price Index. After the CPI numbers, US yields dropped sharply and the US dollar tumbled. The 10-year yield fell from 3.74% to 3.69%, and the DXY hit three-week lows near 103.00.
XAU/USD jumped to test the $1,970 resistance area but failed to break higher and pulled back. If it surpasses that level, more gains could be seen, targeting initially $1,975 and then June highs at $1,985. On the downside, support emerges at $1,950 followed by $1,938.
Technical Levels: Supports and Resistances
XAUUSD currently trading at 1960.33 at the time of writing. Pair opened at 1957.86 and is trading with a change of 0.13 % .
| Overview | Overview.1 | |
|---|---|---|
| 0 | Today last price | 1960.33 |
| 1 | Today Daily Change | 2.47 |
| 2 | Today Daily Change % | 0.13 |
| 3 | Today daily open | 1957.86 |
The pair is trading below its 20 Daily moving average @ 1962.01, below its 50 Daily moving average @ 1989.95 , above its 100 Daily moving average @ 1941.51 and above its 200 Daily moving average @ 1842.83
| Trends | Trends.1 | |
|---|---|---|
| 0 | Daily SMA20 | 1962.01 |
| 1 | Daily SMA50 | 1989.95 |
| 2 | Daily SMA100 | 1941.51 |
| 3 | Daily SMA200 | 1842.83 |
The previous day high was 1967.05 while the previous day low was 1949.26. The daily 38.2% Fib levels comes at 1956.06, expected to provide support. Similarly, the daily 61.8% fib level is at 1960.25, expected to provide support.
Note the levels of interest below:
- Pivot support is noted at 1949.06, 1940.27, 1931.27
- Pivot resistance is noted at 1966.85, 1975.85, 1984.64
| Levels | Levels.1 |
|---|---|
| Previous Daily High | 1967.05 |
| Previous Daily Low | 1949.26 |
| Previous Weekly High | 1973.15 |
| Previous Weekly Low | 1938.15 |
| Previous Monthly High | 2079.76 |
| Previous Monthly Low | 1932.12 |
| Daily Fibonacci 38.2% | 1956.06 |
| Daily Fibonacci 61.8% | 1960.25 |
| Daily Pivot Point S1 | 1949.06 |
| Daily Pivot Point S2 | 1940.27 |
| Daily Pivot Point S3 | 1931.27 |
| Daily Pivot Point R1 | 1966.85 |
| Daily Pivot Point R2 | 1975.85 |
| Daily Pivot Point R3 | 1984.64 |
[/s2If]
Nehcap Expert Advisor
The NEHCAP MT4 EA is high quality professional trading system geared to generate returns without using GRID or martingales. Each trade has strict risk per trade parameter. The pairs under management include EURUSD, GBPUSD, AUDCAD, AUDNZD,GBPAUD, EURAUD, EURCAD, CHFJPY and many more.
The system is trading live: LIVE ACCOUNT TRACKING
You can run it free. Apply for a free trial and track our account. Buy the system or use profit share mechanism to generate returns on your MT4.
Join Our Telegram Group


