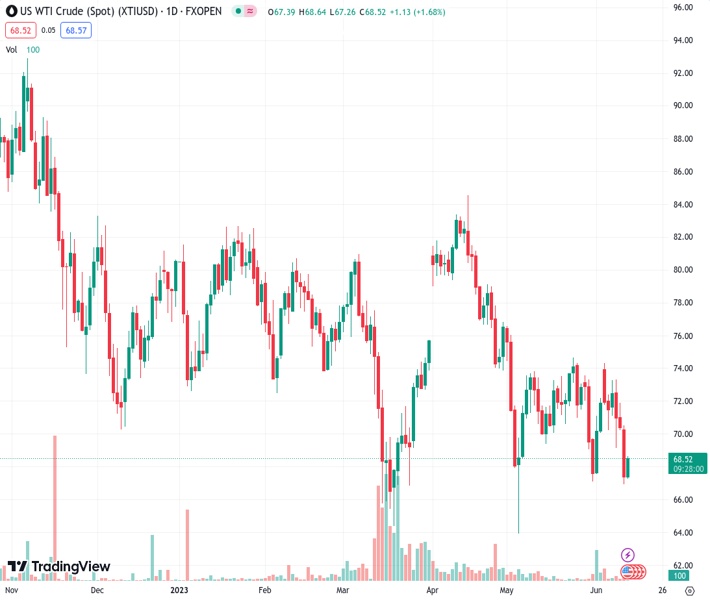
Although crude oil prices experienced a considerable improvement from $67.00, their upward potential appears to be limited.
…
This is a premium post.
[s2If !current_user_can(access_s2member_level4)]Please register for FREE REGISTER to read full post below containing analysis. In case of any error or you think you are not able to read the full post below, please email us at support#nehcap.com [lwa][/s2If] [s2If current_user_can(access_s2member_level1)]
- Oil prices have shown a solid recovery from $67.00, however, the upside seems restricted.
The pair currently trades last at 68.56.
The previous day high was 70.58 while the previous day low was 66.95. The daily 38.2% Fib levels comes at 68.34, expected to provide support. Similarly, the daily 61.8% fib level is at 69.19, expected to provide resistance.
West Texas Intermediate (WTI), futures on NYMEX, have displayed a stellar recovery after finding significant support near $67.00 in the European session. The recovery move in the oil price seems restricted as investors are awaiting the announcement of the interest rate decision by the Federal Reserve (Fed), which will be announced on Wednesday.
The street is cautious about Fed’s policy as further policy-tightening stance by Fed chair Jerome Powell would propel fears of a recession in the United States. The oil price is still going through the pain of bleak demand in China and higher chances of a recession in the Eurozone. And, solidifying hopes of a recession in the US economy might force the black gold for a nosedive move.
The situation of deflation in consumer and producer data in China indicates that weaker domestic demand and exports are weighing significant pressure on factory activity. Firms are underutilizing their capacity despite supportive monetary and fiscal policies by the Chinese administration.
On the Eurozone front, the German economy has already marked a recession. A display of contraction in Gross Domestic Product (GDP) figures consecutively for two times is considered a technical recession. And, in the final reading of Eurozone Q1 GDP, the contraction has been noticed. Consistent weak factory activity in Eurozone has bolstered hopes of a continuation of contraction in GDP.
Before the Fed’s policy, US Consumer Price Index (CPI) data will be keenly watched. Analysts at RBC Economics expect annual growth in the US CPI to slow substantially to 4.1% in May from 4.9% in April. Gas prices were 20% below year-ago levels in May. Oil prices are down after surging in the wake of Russia’s invasion of Ukraine. And soaring food inflation has cooled in recent months with back-to-back MoM declines in grocery prices over March and April. A case of surprisingly higher US inflation might weigh significant pressure on the oil price.
Technical Levels: Supports and Resistances
XTIUSD currently trading at 68.56 at the time of writing. Pair opened at 67.48 and is trading with a change of 1.6 % .
| Overview | Overview.1 | |
|---|---|---|
| 0 | Today last price | 68.56 |
| 1 | Today Daily Change | 1.08 |
| 2 | Today Daily Change % | 1.60 |
| 3 | Today daily open | 67.48 |
The pair remains strongly bearish on the daily time frame. It trades below the 20 SMA @ 71.46, 50 SMA 74.5, 100 SMA @ 75.14 and 200 SMA @ 78.48.
| Trends | Trends.1 | |
|---|---|---|
| 0 | Daily SMA20 | 71.46 |
| 1 | Daily SMA50 | 74.50 |
| 2 | Daily SMA100 | 75.14 |
| 3 | Daily SMA200 | 78.48 |
The previous day high was 70.58 while the previous day low was 66.95. The daily 38.2% Fib levels comes at 68.34, expected to provide support. Similarly, the daily 61.8% fib level is at 69.19, expected to provide resistance.
Note the levels of interest below:
- Pivot support is noted at 66.1, 64.71, 62.47
- Pivot resistance is noted at 69.72, 71.96, 73.34
| Levels | Levels.1 |
|---|---|
| Previous Daily High | 70.58 |
| Previous Daily Low | 66.95 |
| Previous Weekly High | 74.36 |
| Previous Weekly Low | 69.17 |
| Previous Monthly High | 76.61 |
| Previous Monthly Low | 64.31 |
| Daily Fibonacci 38.2% | 68.34 |
| Daily Fibonacci 61.8% | 69.19 |
| Daily Pivot Point S1 | 66.10 |
| Daily Pivot Point S2 | 64.71 |
| Daily Pivot Point S3 | 62.47 |
| Daily Pivot Point R1 | 69.72 |
| Daily Pivot Point R2 | 71.96 |
| Daily Pivot Point R3 | 73.34 |
[/s2If]
Nehcap Expert Advisor
The NEHCAP MT4 EA is high quality professional trading system geared to generate returns without using GRID or martingales. Each trade has strict risk per trade parameter. The pairs under management include EURUSD, GBPUSD, AUDCAD, AUDNZD,GBPAUD, EURAUD, EURCAD, CHFJPY and many more.
The system is trading live: LIVE ACCOUNT TRACKING
You can run it free. Apply for a free trial and track our account. Buy the system or use profit share mechanism to generate returns on your MT4.
Join Our Telegram Group


