If the AUDUSD pair remains strong and maintains its position above the 100-day Simple Moving Average, it could potentially lead to further growth.
…
This is a premium post.
[s2If !current_user_can(access_s2member_level4)]Please register for FREE REGISTER to read full post below containing analysis. In case of any error or you think you are not able to read the full post below, please email us at support#nehcap.com [lwa][/s2If] [s2If current_user_can(access_s2member_level1)]
- A sustained strength above the 100-day SMA supports prospects for additional gains.
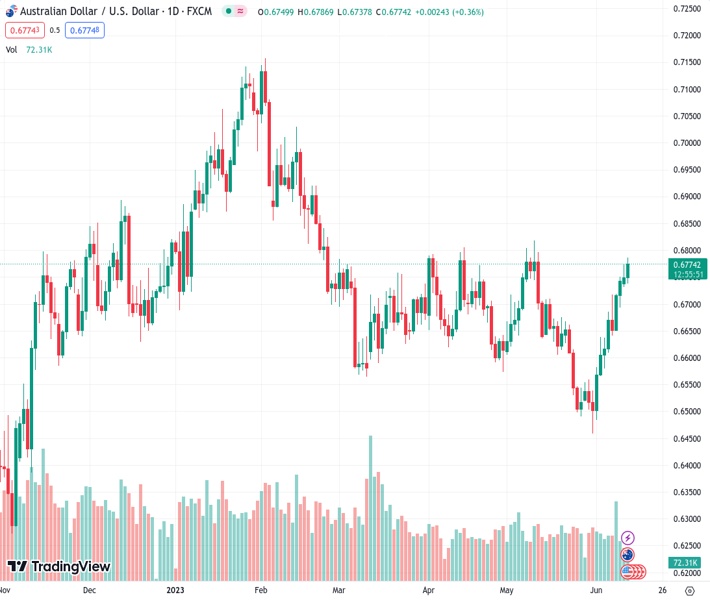
The pair currently trades last at 0.67709.
The previous day high was 0.6774 while the previous day low was 0.6732. The daily 38.2% Fib levels comes at 0.6757, expected to provide support. Similarly, the daily 61.8% fib level is at 0.6748, expected to provide support.
AUD/USD gains traction for the fourth straight day and climbs to over a one-month top.
The AUD/USD pair scales higher for the fourth successive day on Tuesday – also marking the eighth day of a positive move in the previous nine – and jumps to over a one-month high during the early part of the European session. The pair currently trades near the 0.6770-0.6775 region, up nearly 0.35% for the day, and seems poised to prolong its recent strong recovery move from the YTD low touched on May 31.
Firming expectations that the Federal Reserve (Fed) will skip hiking interest rates in June trigger a fresh leg down in the US Treasury bond yields and exert some downward pressure on the US Dollar (USD). Apart from this, a generally positive tone around the equity markets further undermines the safe-haven Greenback. This, along with the Reserve Bank of Australia’s (RBA) surprise 25 bps rate hike last week and a more hawkish policy statement, continues to boost the risk-sensitive Aussie and acts as a tailwind for the AUD/USD pair.
From a technical perspective, the overnight close above the 100-day Simple Moving Average (SMA) was seen as a fresh trigger for bullish traders. The subsequent move up on Tuesday validates the constructive setup, which, along with positive oscillators on the daily chart, support prospects for a further near-term appreciating move. Hence, some follow-through strength beyond the 0.6800 mark, towards testing the May monthly top around the 0.6815-0.6820 region, looks like a distinct possibility ahead of the release of the US consumer inflation figures.
On the flip side, the 100-day SMA, currently pegged around the 0.6735-0.6730 area, now seems to act as immediate support ahead of the 0.6700 mark. This is closely followed by the very important 200-day SMA, currently around the 0.6680 area, which if broken might prompt some technical selling and make the AUD/USD pair vulnerable. Spot prices might then accelerate the fall further below the 0.6645 intermediate support, towards retesting the 0.6600 round-figure mark. A convincing break below the latter will shift the bias in favour of bearish traders.
Technical Levels: Supports and Resistances
AUDUSD currently trading at 0.6776 at the time of writing. Pair opened at 0.675 and is trading with a change of 0.39 % .
| Overview | Overview.1 | |
|---|---|---|
| 0 | Today last price | 0.6776 |
| 1 | Today Daily Change | 0.0026 |
| 2 | Today Daily Change % | 0.3900 |
| 3 | Today daily open | 0.6750 |
The pair remains strongly bullish on the daily timeframe. It trades above its 20 SMA @ 0.6615, 50 SMA 0.6662, 100 SMA @ 0.6738 and 200 SMA @ 0.6691.
| Trends | Trends.1 | |
|---|---|---|
| 0 | Daily SMA20 | 0.6615 |
| 1 | Daily SMA50 | 0.6662 |
| 2 | Daily SMA100 | 0.6738 |
| 3 | Daily SMA200 | 0.6691 |
The previous day high was 0.6774 while the previous day low was 0.6732. The daily 38.2% Fib levels comes at 0.6757, expected to provide support. Similarly, the daily 61.8% fib level is at 0.6748, expected to provide support.
Note the levels of interest below:
- Pivot support is noted at 0.673, 0.671, 0.6688
- Pivot resistance is noted at 0.6772, 0.6794, 0.6814
| Levels | Levels.1 |
|---|---|
| Previous Daily High | 0.6774 |
| Previous Daily Low | 0.6732 |
| Previous Weekly High | 0.6751 |
| Previous Weekly Low | 0.6579 |
| Previous Monthly High | 0.6818 |
| Previous Monthly Low | 0.6458 |
| Daily Fibonacci 38.2% | 0.6757 |
| Daily Fibonacci 61.8% | 0.6748 |
| Daily Pivot Point S1 | 0.6730 |
| Daily Pivot Point S2 | 0.6710 |
| Daily Pivot Point S3 | 0.6688 |
| Daily Pivot Point R1 | 0.6772 |
| Daily Pivot Point R2 | 0.6794 |
| Daily Pivot Point R3 | 0.6814 |
[/s2If]
Nehcap Expert Advisor
The NEHCAP MT4 EA is high quality professional trading system geared to generate returns without using GRID or martingales. Each trade has strict risk per trade parameter. The pairs under management include EURUSD, GBPUSD, AUDCAD, AUDNZD,GBPAUD, EURAUD, EURCAD, CHFJPY and many more.
The system is trading live: LIVE ACCOUNT TRACKING
You can run it free. Apply for a free trial and track our account. Buy the system or use profit share mechanism to generate returns on your MT4.
Join Our Telegram Group


