For the second day in a row, the USDIDR maintained a small decline due to a decrease in growth for Indonesia’s retail sales.
…
This is a premium post.
[s2If !current_user_can(access_s2member_level4)]Please register for FREE REGISTER to read full post below containing analysis. In case of any error or you think you are not able to read the full post below, please email us at support#nehcap.com [lwa][/s2If] [s2If current_user_can(access_s2member_level1)]
- USD/IDR sticks to mild losses for the second consecutive day as Indonesia Retail Sales growth eases.
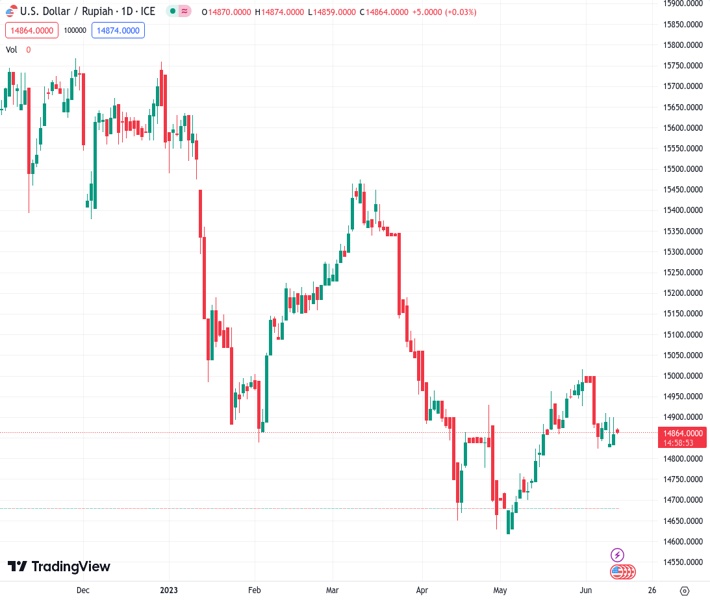
The pair currently trades last at 14865.0.
The previous day high was 14907.45 while the previous day low was 14840.0. The daily 38.2% Fib levels comes at 14865.7659, expected to provide resistance. Similarly, the daily 61.8% fib level is at 14881.6841, expected to provide resistance.
USD/IDR holds lower ground near 14,858 as it drops for the second consecutive day amid broad US Dollar weakness. In doing so, the pair ignores downbeat Indonesia Retail Sales. It’s worth noting, however, that the Indonesia Rupiah (IDR) struggles to extend the two-day downtrend amid cautious markets ahead of the US Consumer Price Index (CPI) data for the stated month.
That said, Indonesia Retail Sales for April report a softer growth of 1.5% versus 4.9% previous readings.
On the other hand, US Dollar Index (DXY) snaps a two-day uptrend with a 0.30% intraday loss to near 103.32 by the press time. In doing so, the greenback’s gauge versus six major currencies bears the burden of the downbeat bets on Wednesday’s Federal Open Market Committee (FOMC) monetary policy meeting.
Softer US data and unimpressive Fed talks allow traders to remain dovish on the US central bank. While portraying the same, the CME’s FedWatch Tool suggests more than a 70% chance of the Fed’s inaction on Wednesday while suggesting nearly 80% odds favoring the 0.25% rate increase in July.
It should be noted that the upbeat sentiment in the Asia-Pacific zone, mainly due to the People’s Bank of China’s (PBoC) rate cut, exert downside pressure on the USD/IDR price.
Against this backdrop, the S&P500 Futures print mild gains at the highest level since April 2022, marked the previous day, whereas the US 10-year and two-year Treasury bond yields register minor downside during the second consecutive day to around 3.72% and 4.56% in that order.
Moving on, the USD/IDR pair traders should keep their eyes on the US Consumer Price Index (CPI) figures for May as it bears the market forecasts of witnessing no change in the Core CPI MoM figure of 0.4%. The same could push back the July rate hike concerns and may not allow the Fed to sound hawkish, which in turn keeps the pair sellers hopeful.
Repeated failure to cross the 21-DMA hurdle, currently around 14,910, keeps USD/IDR bears hopeful.
Technical Levels: Supports and Resistances
USDIDR currently trading at 14859 at the time of writing. Pair opened at 14873.25 and is trading with a change of -0.10% % .
| Overview | Overview.1 | |
|---|---|---|
| 0 | Today last price | 14859 |
| 1 | Today Daily Change | -14.2500 |
| 2 | Today Daily Change % | -0.10% |
| 3 | Today daily open | 14873.25 |
The pair remains strongly bearish on the daily time frame. It trades below the 20 SMA @ 14912.5875, 50 SMA 14859.279, 100 SMA @ 15023.4505 and 200 SMA @ 15222.9435.
| Trends | Trends.1 | |
|---|---|---|
| 0 | Daily SMA20 | 14912.5875 |
| 1 | Daily SMA50 | 14859.2790 |
| 2 | Daily SMA100 | 15023.4505 |
| 3 | Daily SMA200 | 15222.9435 |
The previous day high was 14907.45 while the previous day low was 14840.0. The daily 38.2% Fib levels comes at 14865.7659, expected to provide resistance. Similarly, the daily 61.8% fib level is at 14881.6841, expected to provide resistance.
Note the levels of interest below:
- Pivot support is noted at 14839.6833, 14806.1167, 14772.2333
- Pivot resistance is noted at 14907.1333, 14941.0167, 14974.5833
| Levels | Levels.1 |
|---|---|
| Previous Daily High | 14907.4500 |
| Previous Daily Low | 14840.0000 |
| Previous Weekly High | 15003.0000 |
| Previous Weekly Low | 14140.0500 |
| Previous Monthly High | 15029.0500 |
| Previous Monthly Low | 14571.8000 |
| Daily Fibonacci 38.2% | 14865.7659 |
| Daily Fibonacci 61.8% | 14881.6841 |
| Daily Pivot Point S1 | 14839.6833 |
| Daily Pivot Point S2 | 14806.1167 |
| Daily Pivot Point S3 | 14772.2333 |
| Daily Pivot Point R1 | 14907.1333 |
| Daily Pivot Point R2 | 14941.0167 |
| Daily Pivot Point R3 | 14974.5833 |
[/s2If]
Nehcap Expert Advisor
The NEHCAP MT4 EA is high quality professional trading system geared to generate returns without using GRID or martingales. Each trade has strict risk per trade parameter. The pairs under management include EURUSD, GBPUSD, AUDCAD, AUDNZD,GBPAUD, EURAUD, EURCAD, CHFJPY and many more.
The system is trading live: LIVE ACCOUNT TRACKING
You can run it free. Apply for a free trial and track our account. Buy the system or use profit share mechanism to generate returns on your MT4.
Join Our Telegram Group


