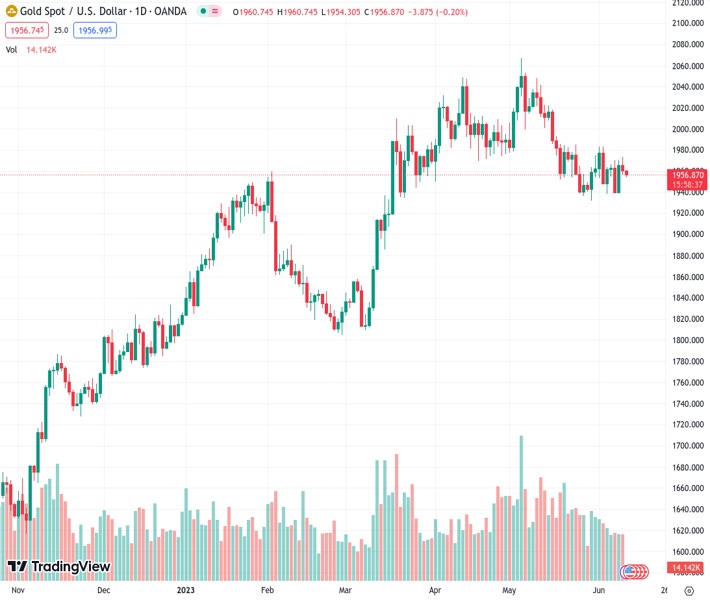
#XAUUSD @ 1,956.66 Gold Price remains pressured below short-term key resistances as key data, events loom.
…
This is a premium post.
[s2If !current_user_can(access_s2member_level4)]Please register for FREE REGISTER to read full post below containing analysis. In case of any error or you think you are not able to read the full post below, please email us at support#nehcap.com [lwa][/s2If] [s2If current_user_can(access_s2member_level1)]
- Gold Price remains pressured below short-term key resistances as key data, events loom.
- Doubts about dovish Fed verdict, US Dollar consolidation exert downside pressure on XAU/USD.
- Light calendar may allow Gold buyers to take a breather after two-week dominance, US inflation appears crucial for clear directions.
Gold Price (XAU/USD) pares intraday losses, after posting a two-week uptrend, as the key week comprising the top-tier central bank announcements and US inflation data loom. That said, the market’s cautious optimism fails to keep pressuring the US Dollar amid reassessment of the previous dovish bias about the Federal Reserve (Fed).
Furthermore, hopes of witnessing no rate change from China, Japan and a pause in the US Treasury bond yields prod the Gold buyers as they look to the US inflation data for confirming a no rate hike consensus from the Fed. That said, CME’s FedWatch Tool suggests a nearly 70% chance of the US central bank’s no change to the benchmark rate.
Looking ahead, Tuesday’s US Core Consumer Price Index (CPI) will be the key to determining near-term Gold Price moves as markets do expect a pause in the Fed’s hawkish trajectory even as the inflation fears loom.
Also read: Gold Price Forecast: XAU/USD appears vulnerable below 21 DMA ahead of key event risks
Our Technical Confluence Indicator suggests that the Gold Price edges lower past the $1,960 key resistance comprising Fibonacci 23.6% in one-day and the middle band of the Bollinger on the hourly play.
Also acting as the immediate upside hurdle is the convergence of 10-DMA and 5-DMA, around $1,958.
It should be noted, however, that the Fibonacci 61.8% in the one-day and 23.6% in the one-month, near $1,970, appears a short-term key resistance for the Gold buyers to cross.
Meanwhile, the 10-DMA joins the Pivot Point one-week S1 to highlight short-term support around $1,941, a break of which could make the Gold Price vulnerable to challenging the yearly low marked in March around $1,932.
In a case where the Gold Price remains bearish past $1,932, the odds of witnessing a fresh fall toward the $1,900 round figure can’t be ruled out.
The TCD (Technical Confluences Detector) is a tool to locate and point out those price levels where there is a congestion of indicators, moving averages, Fibonacci levels, Pivot Points, etc. If you are a short-term trader, you will find entry points for counter-trend strategies and hunt a few points at a time. If you are a medium-to-long-term trader, this tool will allow you to know in advance the price levels where a medium-to-long-term trend may stop and rest, where to unwind positions, or where to increase your position size.
[/s2If]
Nehcap Expert Advisor
The NEHCAP MT4 EA is high quality professional trading system geared to generate returns without using GRID or martingales. Each trade has strict risk per trade parameter. The pairs under management include EURUSD, GBPUSD, AUDCAD, AUDNZD,GBPAUD, EURAUD, EURCAD, CHFJPY and many more.
The system is trading live: LIVE ACCOUNT TRACKING
You can run it free. Apply for a free trial and track our account. Buy the system or use profit share mechanism to generate returns on your MT4.
Join Our Telegram Group
")


