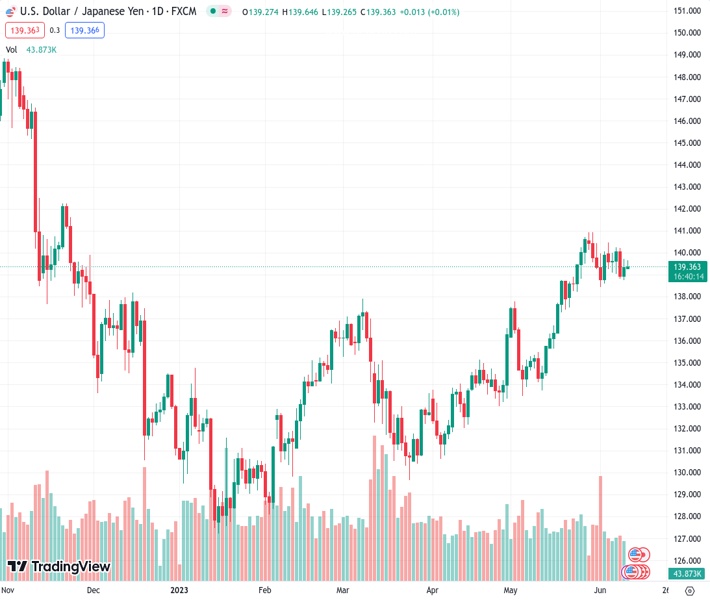
#USDJPY @ 139.355 scales higher for the second straight day, though the upside potential seems limited. (Pivot Orderbook analysis)
…
This is a premium post.
[s2If !current_user_can(access_s2member_level4)]Please register for FREE REGISTER to read full post below containing analysis. In case of any error or you think you are not able to read the full post below, please email us at support#nehcap.com [lwa][/s2If] [s2If current_user_can(access_s2member_level1)]
- USD/JPY scales higher for the second straight day, though the upside potential seems limited.
- Expectations that the BoJ will stick to its dovish stance weigh on the JPY and act as a tailwind.
- A modest USD strength further lends support and contributes to the modest intraday uptick.
- Traders might refrain from placing fresh bets ahead of this week’s key central bank event risks.
The pair currently trades last at 139.355.
The previous day high was 139.72 while the previous day low was 138.76. The daily 38.2% Fib levels comes at 139.36, expected to provide resistance. Similarly, the daily 61.8% fib level is at 139.13, expected to provide support.
The USD/JPY pair gains some positive traction for the second successive day and climbs back above mid-139.00s during the Asian session on Monday.
The Japanese Yen (JPY) weakens a bit on the first day of a new week in reaction to the dismal domestic data, showing that Japan’s Producer Price Index (PPI) decelerated more than anticipated, to 5.1% YoY in May from the 5.9% previous. Adding to this, the Bank of Japan Deputy Governor Masazumi Wakatabe ruled out the possibility of any change in the central bank’s monetary policy stance later this week. This, along with a modest mildly positive risk tone, undermines the safe-haven JPY and acts as a tailwind for the USD/JPY pair.
The US Dollar (USD), on the other hand, builds on Friday’s modest bounce from its lowest level since May 24 and gains some follow-through traction, which is seen as another factor that contributes to the bid tone surrounding the USD/JPY pair. The USD uptick, however, lacks bullish conviction as investors remain uncertain over the Federal Reserve’s (Fed) rate hike path. In fact, the recent dovish rhetoric by several Fed officials reaffirmed market expectations that the US central bank is more likely to skip raising interest rates in June.
That said, surprise rate hikes by the Reserve Bank of Australia (RBA) and the Bank of Canada (BoC) last week suggested that the fight against inflation is not over yet. This, in turn, supports prospects for further policy tightening by the Fed and keeps alive hopes for another 25 bps lift-off in July. Hence, the market focus will remain glued to this week’s release of the latest US consumer inflation figures on Tuesday, which will be followed by the outcome of the highly-anticipated FOMC monetary policy meeting on Wednesday.
Investors will look for fresh clues about the Fed’s near-term policy outlook, which will play a key role in influencing the USD price dynamics. Apart from this, the BoJ policy meeting on Thursday should assist market participants to determine the next leg of a directional move for the USD/JPY pair. In the meantime, traders might refrain from placing aggressive bets in the absence of any relevant market-moving economic releases from the US, warranting some caution before positioning for any further intraday appreciating move.
Technical Levels: Supports and Resistances
USDJPY currently trading at 139.49 at the time of writing. Pair opened at 139.39 and is trading with a change of 0.07 % .
| Overview | Overview.1 | |
|---|---|---|
| 0 | Today last price | 139.49 |
| 1 | Today Daily Change | 0.10 |
| 2 | Today Daily Change % | 0.07 |
| 3 | Today daily open | 139.39 |
The pair remains strongly bullish on the daily timeframe. It trades above its 20 SMA @ 139.01, 50 SMA 136.05, 100 SMA @ 134.5 and 200 SMA @ 137.3.
| Trends | Trends.1 | |
|---|---|---|
| 0 | Daily SMA20 | 139.01 |
| 1 | Daily SMA50 | 136.05 |
| 2 | Daily SMA100 | 134.50 |
| 3 | Daily SMA200 | 137.30 |
The previous day high was 139.72 while the previous day low was 138.76. The daily 38.2% Fib levels comes at 139.36, expected to provide resistance. Similarly, the daily 61.8% fib level is at 139.13, expected to provide support.
Note the levels of interest below:
- Pivot support is noted at 138.86, 138.32, 137.89
- Pivot resistance is noted at 139.82, 140.26, 140.79
| Levels | Levels.1 |
|---|---|
| Previous Daily High | 139.72 |
| Previous Daily Low | 138.76 |
| Previous Weekly High | 140.45 |
| Previous Weekly Low | 138.76 |
| Previous Monthly High | 140.93 |
| Previous Monthly Low | 133.50 |
| Daily Fibonacci 38.2% | 139.36 |
| Daily Fibonacci 61.8% | 139.13 |
| Daily Pivot Point S1 | 138.86 |
| Daily Pivot Point S2 | 138.32 |
| Daily Pivot Point S3 | 137.89 |
| Daily Pivot Point R1 | 139.82 |
| Daily Pivot Point R2 | 140.26 |
| Daily Pivot Point R3 | 140.79 |
[/s2If]
Nehcap Expert Advisor
The NEHCAP MT4 EA is high quality professional trading system geared to generate returns without using GRID or martingales. Each trade has strict risk per trade parameter. The pairs under management include EURUSD, GBPUSD, AUDCAD, AUDNZD,GBPAUD, EURAUD, EURCAD, CHFJPY and many more.
The system is trading live: LIVE ACCOUNT TRACKING
You can run it free. Apply for a free trial and track our account. Buy the system or use profit share mechanism to generate returns on your MT4.
Join Our Telegram Group
")


