#USDCNH @ 7.15434 scales higher for the second straight day and climbs to a fresh YTD top on Monday. (Pivot Orderbook analysis)
…
This is a premium post.
[s2If !current_user_can(access_s2member_level4)]Please register for FREE REGISTER to read full post below containing analysis. In case of any error or you think you are not able to read the full post below, please email us at support#nehcap.com [lwa][/s2If] [s2If current_user_can(access_s2member_level1)]
- USD/CNH scales higher for the second straight day and climbs to a fresh YTD top on Monday.
- The formation of an ascending channel favours bulls and supports prospects for further gains.
- A slightly overbought RSI on the daily chart might cap any further upside, for the time being.
The pair currently trades last at 7.15434.
The previous day high was 7.1464 while the previous day low was 7.1166. The daily 38.2% Fib levels comes at 7.1351, expected to provide support. Similarly, the daily 61.8% fib level is at 7.128, expected to provide support.
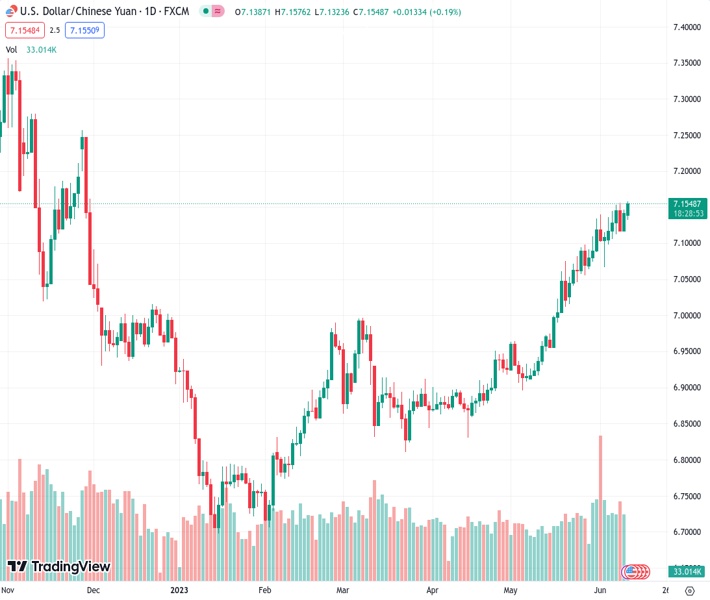
The USD/CNH pair gains some positive traction for the second successive day and climbs to its highest level since November 2022, around the 7.1575 region during the Asian session on Monday.
The upward trajectory witnessed over the past four weeks or so has been along an ascending channel and points to a well-established bullish trend. This, along with the recent breakout through the 7.0000 psychological mark, supports prospects for a further near-term appreciating move. That said, the Relative Strength Index (RSI) on the daily chart has moved on the verge of breaking into the overbought territory and warrants some caution.
Hence, any subsequent move up is likely to confront stiff resistance and remain capped near the top end of the aforementioned trend channel, currently pegged around the 7.1765-7.1770 region. A sustained strength beyond, however, will be seen as a fresh trigger for bulls and allow the USD/CNH pair to reclaim the 7.2000 mark for the first time since November 2022.
On the flip side, any meaningful pullback seems to find decent support and attract fresh buyers near the 7.1200-7.1150 horizontal zone. This should help limit the downside for the USD/CNH pair near the trend-channel support, currently around the 7.1030 area, which is closely followed by the 7.1000 round-figure mark. A convincing break below the latter will negate the constructive setup and shift the near-term bias in favour of bearish traders.
Technical Levels: Supports and Resistances
USDCNH currently trading at 7.155 at the time of writing. Pair opened at 7.1432 and is trading with a change of 0.17 % .
| Overview | Overview.1 | |
|---|---|---|
| 0 | Today last price | 7.1550 |
| 1 | Today Daily Change | 0.0118 |
| 2 | Today Daily Change % | 0.1700 |
| 3 | Today daily open | 7.1432 |
The pair remains strongly bullish on the daily timeframe. It trades above its 20 SMA @ 7.0777, 50 SMA 6.9765, 100 SMA @ 6.9181 and 200 SMA @ 6.9867.
| Trends | Trends.1 | |
|---|---|---|
| 0 | Daily SMA20 | 7.0777 |
| 1 | Daily SMA50 | 6.9765 |
| 2 | Daily SMA100 | 6.9181 |
| 3 | Daily SMA200 | 6.9867 |
The previous day high was 7.1464 while the previous day low was 7.1166. The daily 38.2% Fib levels comes at 7.1351, expected to provide support. Similarly, the daily 61.8% fib level is at 7.128, expected to provide support.
Note the levels of interest below:
- Pivot support is noted at 7.1244, 7.1056, 7.0946
- Pivot resistance is noted at 7.1542, 7.1652, 7.184
| Levels | Levels.1 |
|---|---|
| Previous Daily High | 7.1464 |
| Previous Daily Low | 7.1166 |
| Previous Weekly High | 7.1558 |
| Previous Weekly Low | 7.1012 |
| Previous Monthly High | 7.1344 |
| Previous Monthly Low | 6.8962 |
| Daily Fibonacci 38.2% | 7.1351 |
| Daily Fibonacci 61.8% | 7.1280 |
| Daily Pivot Point S1 | 7.1244 |
| Daily Pivot Point S2 | 7.1056 |
| Daily Pivot Point S3 | 7.0946 |
| Daily Pivot Point R1 | 7.1542 |
| Daily Pivot Point R2 | 7.1652 |
| Daily Pivot Point R3 | 7.1840 |
[/s2If]
Nehcap Expert Advisor
The NEHCAP MT4 EA is high quality professional trading system geared to generate returns without using GRID or martingales. Each trade has strict risk per trade parameter. The pairs under management include EURUSD, GBPUSD, AUDCAD, AUDNZD,GBPAUD, EURAUD, EURCAD, CHFJPY and many more.
The system is trading live: LIVE ACCOUNT TRACKING
You can run it free. Apply for a free trial and track our account. Buy the system or use profit share mechanism to generate returns on your MT4.
Join Our Telegram Group
")


