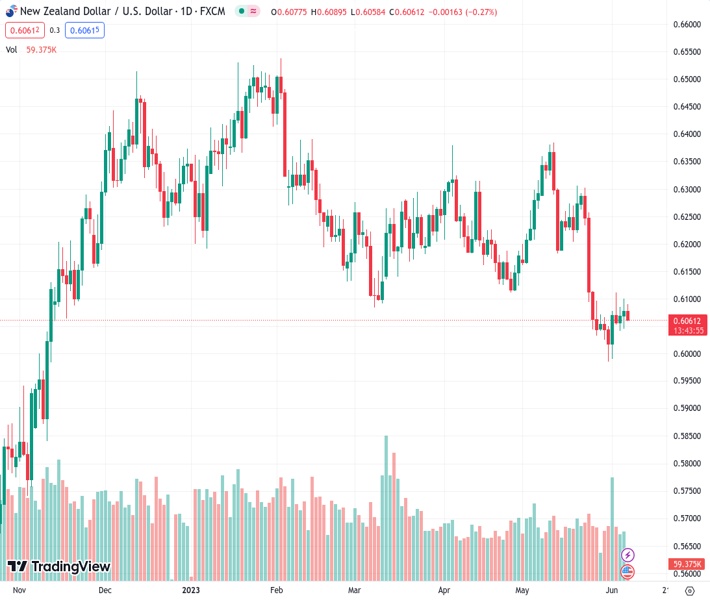
#NZDUSD @ 0.60603 meets with a fresh supply on Wednesday and is pressured by a modest USD uptick. (Pivot Orderbook analysis)
…
This is a premium post.
[s2If !current_user_can(access_s2member_level4)]Please register for FREE REGISTER to read full post below containing analysis. In case of any error or you think you are not able to read the full post below, please email us at support#nehcap.com [lwa][/s2If] [s2If current_user_can(access_s2member_level1)]
- NZD/USD meets with a fresh supply on Wednesday and is pressured by a modest USD uptick.
- Weaker Chinese macro data weigh on investors’ sentiment and benefit the safe-haven buck.
- Bets for an imminent Fed rate-hike pause might cap the USD and help limit losses for the pair.
The pair currently trades last at 0.60603.
The previous day high was 0.61 while the previous day low was 0.6045. The daily 38.2% Fib levels comes at 0.6079, expected to provide resistance. Similarly, the daily 61.8% fib level is at 0.6066, expected to provide resistance.
The NZD/USD pair struggles to capitalize on its modest gains registered over the past two days and comes under some selling pressure on Wednesday. The pair maintains its offered tone through the early European session and is currently placed near the daily low, around the 0.6060 area, down
Weaker-than-expected Chinese macro data released earlier this Wednesday adds to worries about a global economic slowdown and weighs on investors’ sentiment. This is evident from a generally weaker tone around the equity markets, which lends some support to the safe-haven US Dollar (USD) and exerts some downward pressure on the NZD/USD pair. In fact, China’s trade surplus sank to a 13-month low in May, led by a surprise 7.5% slump in exports. The data suggests that overseas demand for Chinese goods remained weak in the wake of worsening economic conditions globally. This, in turn, poses additional headwinds for the world’s second-largest economy and undermines demand for antipodean currencies, including the Kiwi.
The New Zealand Dollar (NZD) is further undermined by the Reserve Bank of New Zealand’s (RBNZ) explicit signal that it was done with its most aggressive hiking cycle since 1999. That said, the uncertainty over the Federal Reserve’s (Fed) next policy move might hold back the USD bulls from placing aggressive bets and help limit losses for the NZD/USD pair. In fact, the recent inflation and labour market data kept alive hopes for a 25 bps lift-off at the June FOMC meeting. However, dovish rhetoric by several Fed officials last week lifted market bets for an imminent pause in the US central bank’s policy tightening cycle. The current market pricing indicates a greater chance that the Fed will leave interest rates unchanged next week.
The expectations lead to a further decline in the US Treasury bond yields, which should continue to act as a headwind for the Greenback and lend some support to the NZD/USD pair. Meanwhile, the recent repeated failures near the 0.6100 round-figure mark favour bearish traders. The aforementioned fundamental backdrop, however, makes it prudent to wait for strong follow-through selling before positioning for any further intraday depreciating move amid absent relevant market-moving economic releases from the US.
Technical Levels: Supports and Resistances
NZDUSD currently trading at 0.6066 at the time of writing. Pair opened at 0.6078 and is trading with a change of -0.2 % .
| Overview | Overview.1 | |
|---|---|---|
| 0 | Today last price | 0.6066 |
| 1 | Today Daily Change | -0.0012 |
| 2 | Today Daily Change % | -0.2000 |
| 3 | Today daily open | 0.6078 |
The pair remains strongly bearish on the daily time frame. It trades below the 20 SMA @ 0.6154, 50 SMA 0.6198, 100 SMA @ 0.6244 and 200 SMA @ 0.6149.
| Trends | Trends.1 | |
|---|---|---|
| 0 | Daily SMA20 | 0.6154 |
| 1 | Daily SMA50 | 0.6198 |
| 2 | Daily SMA100 | 0.6244 |
| 3 | Daily SMA200 | 0.6149 |
The previous day high was 0.61 while the previous day low was 0.6045. The daily 38.2% Fib levels comes at 0.6079, expected to provide resistance. Similarly, the daily 61.8% fib level is at 0.6066, expected to provide resistance.
Note the levels of interest below:
- Pivot support is noted at 0.6049, 0.6019, 0.5993
- Pivot resistance is noted at 0.6104, 0.613, 0.616
| Levels | Levels.1 |
|---|---|
| Previous Daily High | 0.6100 |
| Previous Daily Low | 0.6045 |
| Previous Weekly High | 0.6112 |
| Previous Weekly Low | 0.5985 |
| Previous Monthly High | 0.6385 |
| Previous Monthly Low | 0.5985 |
| Daily Fibonacci 38.2% | 0.6079 |
| Daily Fibonacci 61.8% | 0.6066 |
| Daily Pivot Point S1 | 0.6049 |
| Daily Pivot Point S2 | 0.6019 |
| Daily Pivot Point S3 | 0.5993 |
| Daily Pivot Point R1 | 0.6104 |
| Daily Pivot Point R2 | 0.6130 |
| Daily Pivot Point R3 | 0.6160 |
[/s2If]
Nehcap Expert Advisor
The NEHCAP MT4 EA is high quality professional trading system geared to generate returns without using GRID or martingales. Each trade has strict risk per trade parameter. The pairs under management include EURUSD, GBPUSD, AUDCAD, AUDNZD,GBPAUD, EURAUD, EURCAD, CHFJPY and many more.
The system is trading live: LIVE ACCOUNT TRACKING
You can run it free. Apply for a free trial and track our account. Buy the system or use profit share mechanism to generate returns on your MT4.
Join Our Telegram Group


